| Disaster Management | |
Overview for the prediction of larger earthquakes in Japan
The prediction method is based on the authors’ experience of 13 years as well as three indicators which are computed from daily Global Navigation Satellite System (GNSS) data from about 1,300 Continuously Observing Reference Stations (CORS) established all over Japan by Geo-spatial Information Authority (GSI) |
 |
|
 |
|
The prediction results for seven larger earthquakes that occurred in Japan in 2015 are validated against published mail magazine data that were disseminated to the customers in advance to the earthquakes. The largest earthquake was M8.1 with the epicenter near the Ogasawara Islands in the South Pacific Ocean, about 1000 km from Tokyo. The prediction method is based on the authors’ experience of 13 years as well as three indicators which are computed from daily Global Navigation Satellite System (GNSS) data from about 1,300 Continuously Observing Reference Stations (CORS) established all over Japan by Geospatial Information Authority (GSI).
Although the predictions do not show 100% success, the readers should understand the scientific background to why and how the predictions of these earthquakes were carried out by looking at the graphs and figures shown in this article. All seven earthquakes introduced hereinafter are completely different in strength, epicenter depth, appearance of pre-signals, quake characteristics and so on; therefore it is not easy to predict earthquakes in advance using a single indicator or automatic decision making.
Introduction
Since the earthquake prediction private company, namely Japan Earthquake Science Exploration Agency (JESEA), commenced operations in January 2013, the authors, as the company’s advisors have been responsible for the “Weekly MEGA Earthquake Prediction” which is disseminated to about 50,000 individual customers, mainly through a mail magazine.
For the seven earthquakes larger than Japan Meteorological Agency (JMA) Seismic Intensity 5- (called SI hereinafter) that have already occurred in 2015, the authors have summarized how JESEA has provided the prediction information to the customers in the mail magazine. Although the prediction method using GNSS data has been published several times in “COORDINATES” in the past, it has been improved over the last two years as experience has been accumulated, as well as data analysis and visualization techniques have been improved.
While the authors are not in a position to say that the predictions published in the mail magazine are correct or not, we show how the prediction or pre-signals have been determined. This may be useful for the readers to judge the correctness of the predictions. All this information is based on scientific background represented in graphs or figures to protect ourselves from legal claims.
Because the journalists of magazines and TV are also our customers and they recognized the correctness of the prediction, JESEA’s success in earthquake prediction has been included in about ten magazines and on Fuji TV five times in the last two years.
Remarks: The Richter Scale or so called Magnitude (M) indicates the energy of an earthquake at the epicenter while Seismic Intensity (SI) means the quake intensity which is directly related to the damage caused by the quake. JMA SI is classified into 1, 2, 3, 4, 5-, 5+, 6-, 6+ and a maximum 7. An intensity larger than 5- will be classified as a large earthquake with some sort of damage in Japan. Earthquake damage and SI are not always the largest near the epicenter particularly in the case of a deep earthquake, say deeper than 50 km. For developing preparedness against earthquake damage SI would be more important than Magnitude. Therefore JESEA targets SI rather than M in the prediction.
The prediction method
JESEA so far adopts the following three indicators in its earthquake prediction method.
1) Weekly height change: short term height changes in 7 days. The larger the SI, the greater the number of stations and the wider the area that shows abnormal height changes above 4 cm, which is considered from our experience as the threshold. The indicator is useful to detect sudden changes, which occur in the case of an earthquake with a shallow epicenter or volcanic activity.
2) Increase or decrease in X, Y, Z geocentric coordinates or H (ellipsoidal height) compared with corresponding values two years earlier, or a long term tendency of abnormal increases or decreases in over two years. The maximum increase or decrease in geocentric coordinates or H in a certain area compared with neighboring areas is a critical value and should be useful for predicting quake areas.
3) Six monthly accumulated daily deformations in geo-centric coordinates or H compared with two years earlier are useful indicators of slow changes, which appears in the case of quakes with deep epicenters.
The prediction is undertaken in the two steps. The first step involves computing the above indicators and visualizing them graphically and as figures for comparison with the knowledge based thresholds. The second step involves reviewing the abnormal phenomena considering also the local/regional geographic and geological characteristics, past history of earthquake occurrences, temporal changes or trends over five years, climate and tidal changes and so on.
Of importance are the zones with abnormal phenomena (called presignal by the authors) indicating the possibility of earthquakes larger than 5- SI rather than predicting “where” and “when” they may occur.
Since daily GNSS data from about 1,300 stations in Japan are available every week on Monday on the Internet from GSI free of charge, the authors work hard on the prediction from the afternoon of Monday to the morning of Wednesday each week. In the afternoon of Wednesday JESEA disseminates “weekly MEGA earthquake prediction” to the customers on the Internet. One of the weak points of the prediction method is the lack of accuracy of “when” the actual earthquake will occur, since the time ranges from a few weeks to several months. This is a function of the different types and characteristics of earthquakes. For example an earthquake with a shallow epicenter normally occurs very soon after the occurrence of presignals, say a few weeks after the first presignals have been detected, while a very large earthquake with a deep epicenter can occur slowly, say more than six months after several repeated pre-signals.
Validation of the seven earthquakes for 2015
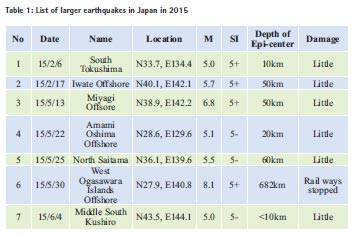
Table 1 shows the seven large earthquakes that have occurred in Japan in 2015 by the beginning of June 2015 and Figure 1 shows their locations. The validation using the published mail magazine information are described in the following which will enable the readers to judge the correctness or the scientific value of the predictions.
South Tokushima Earthquake (M5.0, SI 5+) 2015/2/6; with a depth of 10 km
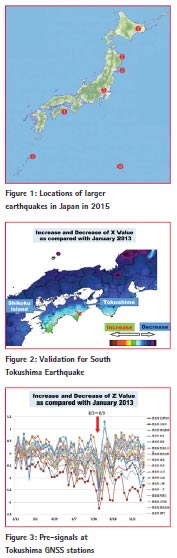
Tokushima Prefecture is located in the south east of Shikoku Island where a huge earthquake occurred with resulting very large Tsunami in the past. People living in the region are seriously afraid of earthquakes but fortunately the damage from this earthquake was minor. The SI value is large compared with M as the epicenter was very shallow. In the mail magazine published on the 17th December 2014, about two months in advance to the occurrence of Tokushima Earthquake, the authors warned that the southern two capes of Shikoku Island showed completely different movement in X axis (East/West direction) compared with other Shikoku areas. The two capes revealed an increase or positive movement, shown in green color in Figure 2, while the other areas revealed a decrease or negative movements displayed in blue color. The epicenter of the earthquake, indicated by X in the figure was located exactly on the boundary between positive and negative movements. In addition we predicted that Tokushima Prefecture would be critical as Tokushima simultaneously showed abnormal presignals in Z values in the beginning of August 2013 as shown in Figure 3 which was also disseminated to the customers.
Iwate Offshore Earthquake (M5.7, SI 5+) 2015/2/17; with a depth of 50 km
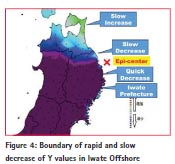
Iwate Prefecture is located in the north east of Tohoku Area which was seriously damaged by the Great East Japan Earthquake and Tsunami of 2011/3/11 with many victims. After the Great Earthquake, Iwate area has been rising drastically although the area subsided several ten of centimeters during the quake. This rise in the area after the Great Earthquake caused an accumulation of new energy for new earthquakes, which have occurred mainly in the three prefectures; Iwate, Miyagi and Fukushima. In the mail magazine published on 10th December 2014 the authors showed how the speed of change in the Y coordinate values (North/ South direction) compared with values in January 2013 in the Iwate Offshore was different as shown in Figure 4. In the mail magazine published on the 18th February 2015 after the earthquake, we explained that the speed of Y value changes displayed large differences between the two northern and six southern stations as shown in Figure 5. Very fortunately the damage from the earthquake was minor.
Miyagi Offshore Earthquake (M6.8, SI 5+) 2015/5/13; with a depth of 50 km
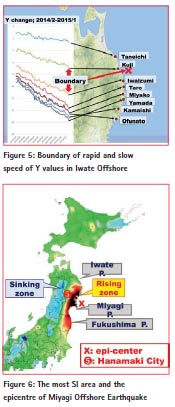
Since the epicenter of the Great Earthquake which occurred on 2011/3/11 was 130 km east offshore of Miyagi Prefecture, the Pacific coast of Miyagi Prefecture revealed the largest rise after the earthquake, while the inner-land of Tohoku showed the largest sinking. These after-changes have generated large earthquakes over the past four years. Therefore in the mail magazines, the authorities in the Pacific Coast of Tohoku as well as the inner land were warned that this is a critical zone indicating future earthquakes. Though the epicenter of the Miyagi Offshore earthquake was located as shown in Figure 6, the largest SI was located at Hanamaki City in the inner land area, which is at the boundary between rising and sinking zones. The boundary between such opposite movements is recognized from experience as a critical zone. In spite of the rather large magnitude quake, the damage was minimal.
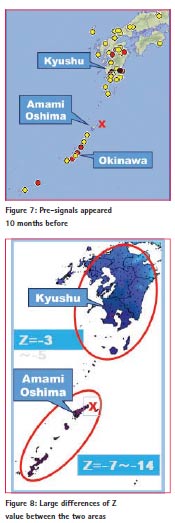
Amami Oshima Offshore Earthquake (M5.1, SI5-) 2015/5/22: with a depth of 20 km
Amami Oshima Island is located about 380 km south west of Kyushu Island and about 200 km north east of Okinawa. There were pre-signals in July 2014, about 10 months before (Figure 7), as well as nine months before the quake. Since then JESEA continued warning that this area should “ extremely careful”. But as the Amami Oshima area had been subsequently calm without any abnormal phenomenon for more than six months JESEA reduced the advisory to “careful” level. However we recognized big differences between the Kyushu Zone and Amami Oshima and Okinawa Zones in Z (height) values as shown in Figure 8. The former zone showed Z value changes in the range of -2 to -5 cm while the latter zone revealed changes of -7 to -14 cm. This differences could trigger an earthquake. The exact time between the appearance of pre-signals and the actual earthquake is very difficult to predict. However it was not surprising that an earthquake occurred following the appearance of these pre-signals. Fortunately the damage was little in this case
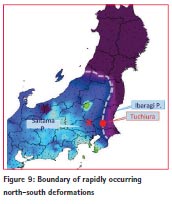
North Saitama Earthquake (M5.5, SI5-) 2015/5/25: with a depth 60 km
As the depth of the epicenter is relatively deep, the largest SI or the most quaked area was about 50 km east of the epicenter namely in Tuchiura City, Ibaragi Prefecture. In the mail magazine, we pointed out that the boundary between rapidly occurring deformations as shown in purple color in Figure 9 and the slowly occurring deformations in blue color in the coordinates in the north/south direction (Y coordinates) may be critical in generating energy for an earthquake. In the figure the boundary between the zones with different deformation characteristics is shown by dotted lines. The most quaked area was Tuchiura City which is located on this boundary. As Tokyo Metropolitan Area was also quaked with SI 4, many railways including subways stopped for a short time to confirm safety.
West Ogasawara Islands Offshore Earthquake (M8.1, SI5+) 2015/5/30: with a depth of 682 km
Though Ogasawara Islands are located about 1,000km south of Tokyo, Tokyo Metropolitan Area was seriously quaked with SI 5+ as well almost all of Japan as shown in Figure 10. This is because the epicenter was very deep at 682 km. It was the deepest epicenter ever recorded in the history of earthquakes in Japan. About 20,000 elevators of tall buildings stopped and almost all railways including “Shinkansen” or bullet train automatically stopped for several hours. Very luckily no one was killed. The quake was rather long with a low frequency.
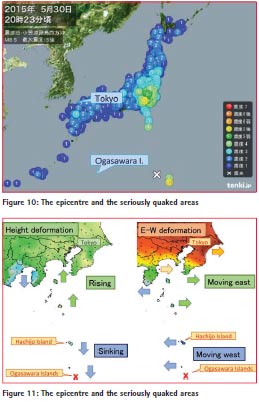
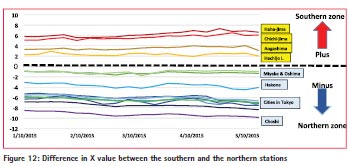
In the mail magazine, we pointed out that the direction of height (Z coordinate) and east-west (X coordinate) deformations for the inland area and south areas were opposite to those for the Hachijo Island to Ogasawara Islands, as shown in Figure 11. These opposing deformations would be a precursor of an earthquake. In addition, about a month before the earthquake there was a pre-signal of height deformation at one of Ogasawara Islands. We also noted the drastic differences in North/South (Y) values between the southern zone, comprising Ogasawara Islands (mainly composed of Chichi-jima and Haha-jima; meaning father and mother island) and Hachijo Island, and the northern zone, comprising Miyake Island, Izu Oshima Island, and the inland area such as Tokyo Metropolitan Area as shown in Figure 12. The former zone shows high changes in Y values (positive) while the latter zone shows small changes in Y values (negative) which would generate large energy to trigger the large earthquake.
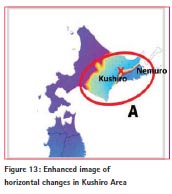
Middle South Kushiro Earthquake (M5.0, SI5-) 2015/5/30: with a depth of 10 km
Kushiro is located in the east of Hokkaido Island where horizontal deformations (X and Y directions) were concentrated and also mixed as shown in Figure 13 which has been enhanced to show the horizontal deformations. In the mail magazine published on the 3rd June 2105 we announced an advisory that Kushiro and Nemuro areas shown by the symbol A and the circle in the figure must be ‘careful’. Just one day after dissemination of the mail magazine to the customers, surprisingly the earthquake occurred because its depth was very shallow. Fortunately little damage occurred in a limited and narrow area.
Conclusion
The seven large earthquakes that have occurred in Japan so far in 2015 have been introduced as well as the methods used for their prediction by the authors based on scientific analysis of GNSS position and elevation data as well as past experience. The critical zones are the boundaries between rapid deformations in GNSS data, which are revealed by changes in the signs of numerical values of coordinates of GNSS data in neighboring zones. Since the type and depth of earthquakes are so different, the occurrence patterns are different which makes it difficult to predict the exact time of an earthquake. However “where” and “how large” can be roughly predicted while “when” ranges from a few weeks to several months depending the earthquake type which as yet is unknown in advance.
Ackonowledges
The authors would like to express their appreciation to Mr. KITTA Toshihiro, the president of JESEA and Mr. TANIKAWA Toshihiro, Executive of JESEA for their kind support of research. The authors also thank GSI for providing weekly GNSS data of 1,300 stations free of charge. The authors would like to appreciate Prof. John Trinder for editing and correcting English.
References
MURAI, S. and ARAKI, H.: Prediction of earthquakes and volcanic eruptions using GNSS data (Japanese): 2003, Technical report, Journal of Surveying, Japan Association of Surveyors
MURAI, S. and ARAKI, H.: Earthquake Prediction using GPS, GIM Intern ational, Volume 17, No. 10, October 2003
MURAI, S. and ARAKI, H.: Prediction of Earthquake and Volcanic Eruption using GPS: Asian Journal of Geoinformatics, Vol. 4, No.3, March 2004
MURAI, S. and ARAKI, H.: Was early warning of Sumatra earthquake possible? Coordinates, Volume 1, Issue 2, 2005.7, p.8-11
MURAI, S. : Report on Tohoku Kanto Great Earthquake and Tsunami 311: ISPRS Highlights, April 2011
MURAI, S. and ARAKI, H.: Crustal Movement before and after the Great East Japan Earthquake, Coordinates, May Issue 2012
MURAI, S. , ARAKI, H. and YANAGI, H.: Towards the prediction of earthquakes with GNSS data, Volume X, Coordinates, May Issue 2014.


 (6 votes, average: 3.67 out of 5)


Leave your response!