| Perspective | |
Our influence on sea level is negligible
IPCC (1990-2013) has adopted an often alarmist stance on the climate question, favouring extreme predictions both of future temperature change and of the consequences of global warming, especially sea-level rise |
 |
|
Sea level rise is the chief pretext for alarm about Man’s influence on climate. Agencies such as the Intergovernmental Panel on Climate Change (IPCC, 1990-2013) have adopted an often unscientifically alarmist stance on the climate question, favouring extreme predictions both of future temperature change and of the consequences of global warming, especially sea-level rise. Those predictions have proven exaggerated.
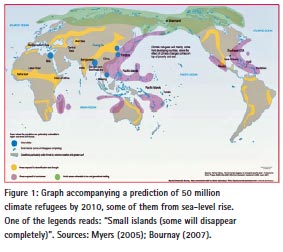
In October 2005, for instance, a United Nations University press release said: “Amid predictions that by 2010 the world will need to cope with as many as 50 million people escaping the effects of creeping environmental deterioration, United Nations University experts say the international community urgently needs to define, recognize and extend support to this new category of ‘refugee’. … Such problems as sea-level rise, expanding deserts and catastrophic weather-induced flooding have already contributed to large permanent migrations and could eventually displace hundreds of millions.”
Earlier that year the Organization for Security and Cooperation in Europe had published a report by Professor Norman Myers, an environmentalist campaigner at Oxford University (Myers, 2005), predicting 50 million “climate refugees” by 2010. In 2007 the report was reproduced in the annual environmental atlas published by Le Monde Diplomatique (Bournay, 2007), with a map (Figure 1) that found its way on to the website of the UN Environment Program, one of the IPCC’s two sponsors.
In 2008 Srgjan Kerim, then president of the UN General Assembly, predicted 50-200 million environmental migrants by 2010. When this forecast failed (population increased in many of the areas said to be under climate stress), UNEP removed the map from its website. The same year James Hansen, the nowretired head of NASA’s Goddard Institute for Space Studies, told The Guardian, a UK newspaper, that sea level would rise by 75 m (almost 250 feet) as a result of manmade global warming (Hansen, 2008):
“If you leave us at 450ppm for long enough it will probably melt all the ice – that’s a sea rise of 75 metres. What we have found is that the target we have all been aiming for is a disaster – a guaranteed disaster.” Fortunately, science has now dismissed such extreme projections as mere rodomontade. For the sole mechanism by which the activities of Man might in theory raise sea level significantly is CO2-driven global warming. CO2 now occupies just 1/10,000 more of the atmosphere than in 1750.
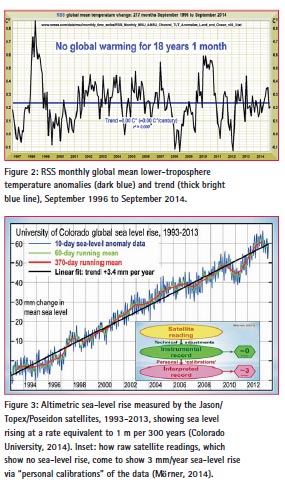
Every month the index of global temperature change, based on the RSS satellite global lower-troposphere temperature-anomaly dataset, shows the longest period ending in the present showing a zero the least-squares linearregression trend. The latest index (Monckton of Brenchley, 2014) shows no warming during the 18 years 1 month September 1996 to September 2014 – more than half the satellite record.
The mean of the GISS, HadCRUT4, NCDC, RSS and UAH global-temperature datasets shows no warming for 13 years. Accordingly, any sea-level rise that may have occurred over the past decade or so is unlikely to have been much influenced by our greenhouse-gas emissions. Since there has been no global warming this millennium, any sea-level rise since 2000 must have been caused either by some natural factor (such as increased activity among the 3.5 million subsea volcanoes most of which have never been visited or monitored) or by what Professor Niklas Mörner, the world’s pre-eminent sealevel expert, has described as “personal calibrations” by the recordkeepers (Mörner, 2011). Professor Mörner has contributed almost 600 papers to the scientific literature in a professorial career spanning almost half a century. It is arguable that the “personal calibrations” that he describes are the chief cause both of uncertainty in the sea-level data and of apparent sea-level rise itself.
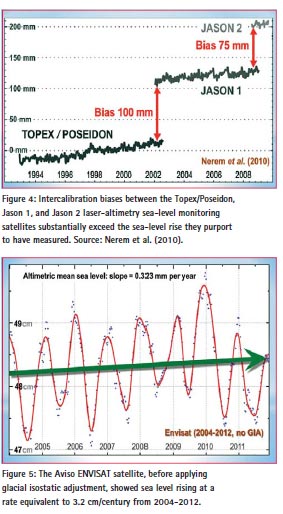
The “official” sea-level record (Colorado University, 2014) is based on altimetry from the Jason/Topex/ Poseidon satellite series. It purports to show a sea-level rise of 3.4 mm/ year, or approximately 1 ft/century (Figure 3). This rate of increase, stable throughout the period of satellite monitoring since 1993, is less alarming than the Myers and Hansen predictions. The “official” published rate of current sea-level rise, though it is well below the headline-grabbing extreme projections that have been made, may itself be an exaggeration. For tide gauges show sea level as having risen in recent decades at a rate of about 1.7 mm/year or 1 m in 600 years. That is half the satellite value. That lower rate shows no increase since 1900.
Furthermore, the (inevitably upward) intercalibration biases between the Topex/ Poseidon, Jason 1 and Jason 2 laseraltimetry sea-level monitoring satellites, at 175 mm, exceed twice the total sea-level rise the satellites have purported to measure.
Two important independent satellite data series confirm the tide-gauge results and disagree with the “official” satellite series. First, unadjusted data from the Aviso ENVISAT satellite, a $3.5 bn flagship EU project which operated from 2004 till it inexplicably failed in April 2012, showed sea level rising at a rate equivalent to only 3.2 cm (1.3 inches) per century (Figure 5).
However, the ENVISAT record, like those of all other satellites, was subjected to (inevitably upward) revision arising from “personal calibrations” calculated to bring the data more closely into line with the “official” sea-level record (Figure 6).
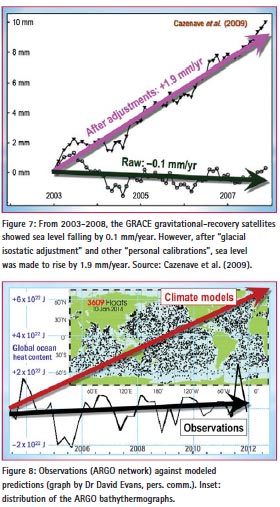
Secondly, the GRACE gravitationalanomaly satellites, perhaps the most accurate method of measuring sealevel change, also show little warming since 2001. However, again there were (inevitably upward) adjustments, this time to incorporate a “glacial isostatic adjustment” for the continuing slow rebound of the great land masses after the last Ice Age (Figure 7).
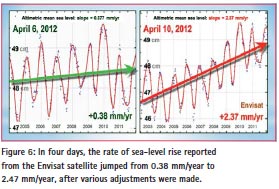
Even after “personal calibrations”, the rate of sea-level rise shown by the GRACE satellites accords with the tide-gauges but not with the “official” sea-level record.
Systemic sea-level rise is driven by melting land ice and thermosteric expansion. However, satellite altimetry shows that the volume of land-based ice in Antarctica has changed little in 35 years, for there has been little warming there, and that the Greenland ice mass increased substantially from 1993-2004 (Johannessen et al., 2005) and declined somewhat thereafter. Thermosteric expansion only occurs if the ocean warms. However, the 3500 automated ARGO bathythermograph buoys deployed throughout the world’s oceans show little increase in the heat content of the global ocean – one-sixth of what had been predicted (Figure 8).
Furthermore, the failure of the atmosphere to warm this millennium is a powerful indication that the ocean to which it is coupled, three orders of magnitude denser, cannot have warmed appreciably: for if the ocean had warmed the atmosphere must have warmed too.
One frequently-publicized explanation for the near-total yet near-totally unpredicted absence of global warming recently is that the coupled ocean-atmosphere system has continued to accumulate heat as models had predicted, but that recently the ocean has removed the heat from the atmosphere by the ocean. Since globally the near-surface strata show far less warming than predicted, it is hypothesized that the “missing heat” has traveled to the little-measured benthic strata below 2000 m, whence it may emerge one day. The ocean “missing heat” theory is chiefly advocated by a single group in the United States (Meehl et al., 2011; Balmaseda et al., 2013; Trenberth et al., 2014a), who say that during periods without global warming the ocean above 300 m takes up significantly less heat, whereas the ocean below 300 m takes up significantly more, compared with periods when warming is occurring, and that more than ninetenths of any overall “thermal imbalance” in the climate is expressed in a rise in ocean heat content. On this theory, global warming has not stopped: it is continuing, but not in the atmosphere. Instead, it is harmlessly accumulating in the deep ocean, from which it may one day reemerge, somewhat in defiance of the laws of thermodynamics, which prohibit the transfer of heat from a colder body to a warmer body with which it is in contact.
To date, however, no empirical, theoretical or numerical method has plausibly specified a mechanism to explain either how the heat generated by anthropogenic greenhouse-gas enrichment of the atmosphere has reached the deep ocean without much altering the heat content of the intervening nearsurface strata or how the heat from the bottom of the ocean may re-emerge to perturb the near-surface climate conditions relevant to land-based life.
Most ocean models erforming coupled general-circulation sensitivity analyses cannot resolve most of the physical processes for capturing heat uptake by the deep ocean. Ultimately, the second law of thermodynamics requires that any heat accumulated in the deep ocean will dissipate slowly and harmlessly by diffusion. It is not plausible that any heat taken up by the deep ocean will suddenly warm the upper ocean and, via the upper ocean, the atmosphere.
Even if heat were reaching the benthic strata without warming the nearsurface strata on the way, the transient near-surface response has proven insensitive to rising atmospheric CO2.
The mean depth of the global ocean is 3700 m. Wunsch & Heimbach (2014), implicitly questioning the “missing heat” group’s assertions, say the resolution of samples at various depths and the length of the record are insufficient either to permit reliable measurement of ocean heat content or monitoring of oceanic radiative fluxes:
“About 52% of the ocean lies below 2000 m and about 18% below 3600 m. By defining a volume as having been ‘probed’ if at least one CTD station existed within a roughly 60 x 60 km2 box in the interval 1992-2011…. [a] bout 1/3 (11% of total volume) of water below 2000 m was sampled… Of the [region] lying below 3600 m, about 17% was measured… [M]any papers assume no significant changes take place in the deep ocean over the historical period … “The history of exploration suggests, however, that blank places on the map have either been assumed to be without any interesting features and dropped from further discussion, or at the other extreme, filled with ‘dragons’ invoked to explain strange reports’ [de Jode, 1578]…”
Furthermore, almost all current analyses of ocean heat content and budget lack an accurate accounting of spatial, temporal and other systematic errors and uncertainties (Cheng & Zhu, 2014; Cheng et al., 2014ab).
The suggestion that sea-level-rise-inducing heat accumulation in the deep ocean explains the standstill in global warming is far from accepted. Many competing and often mutually exclusive explanations, chiefly involving near-surface phenomena, are offered: (1) coverage-induced cool bias in recent years (Cowtan & Way, 2014), rebutted by Fyfe et al., (2013) and, with respect to Arctic coverage, by Chung et al. (2013); (2) anthropogenic aerosols from coal-burning (Kaufmann et al., 2011), rebutted by Kühn et al. (2013) and Neely et al. (2013); (3) decline in the warming caused by black-carbon absorption (Neely et al., 2013); (4) emission of aerosol particulates by volcanic eruptions (Santer et al., 2014), rebutted by Heywood et al. (2014); (5) reduced solar activity (Stauning, 2014); (6) effectiveness of the Montreal Protocol in controlling emissions of chlorofluorocarbons (Estrada et al., 2013); (7) a lower-than-predicted increase in methane concentration (Estrada et al., 2013); (8) a decrease in stratospheric water vapor concentration (Solomon et al., 2010); (9) strengthened Pacific trade winds (England et al., 2014) (previously, Vecchi et al., 2006, had attributed weaker Pacific trade winds to anthropogenic global warming); (10) stadium waves in tropical Pacific circulation (Glaze et al., 2013); (11) coincidence (Schmidt et al., 2014); (12) aerosol particulates from pine-trees Ehn et al., 2014); (13) natural variability (Watanabe et al., 2014; Lovejoy, 2014); (14) cooler night-time temperatures in the Northern Hemisphere (Sillmann et al., 2014); (15) predictions by those models that allowed for the possibility of a pause in global warming Risbey et al., 2014; Guemas et al., 2013); (16) the negative phase of the Pacific Decadal Oscillation (Maher et al., 2014; Trenberth et al., 2014b; Dong & Zhou, 2014); (17) the Atlantic meridional overturning circulation (Schleussner et al., 2014); (18) global dimming following the global brightening of 1983-2001 (Rahimzadeh et al., 2014); (19) relative frequencies of distinct el Niño types (Banholzer & Donner, 2014); (20) surface cooling in the equatorial Pacific (Kosaka & Xie, 2013); (21) Pacific cooling amplified by Atlantic warming (McGregor et al., 2014); (22) a combination of factors, including ENSO variability, solar decline and stratospheric aerosols (Huber & Knutti, 2014); (23) underestimated anthropogenic aerosol forcing (Hansen et al., 2011); (24) a new form of multidecadal variability distinct from but related to the ocean oscillations (Maclas et al., 2014); and (25) failure to initialize most models in order to conform with observation, particularly of oceanic conditions (Meehl & Teng, 2014).
Given the conflicting testimony as to the explanation for the long and unpredicted hiatus in global warming, it is impossible either to assign a single cause to the pause or to assume that the missing heat is in the deep ocean and will thus raise sea level at the high rates predicted by IPCC (2013).
Conclusion
On the evidence, global temperature has not risen at all this millennium, so that there is no reason to expect any sea-level rise above the established, small and harmless long-term rate. It is difficult to discern any manmade contribution to sea-level rise in the raw data. Only in the “official” record, and then only after “personal calibrations”, does faster sealevel rise appear, and only then at the moment of the changeover from tidegauge to satellite-altimetry measurement in 1993. The acceleration may well be a mere artefact of the altered method of measurement. The notion that the absence of global warming this millennium is attributable to the accumulation of heat in the ocean is not demonstrable by sufficiently-resolved measurements and is in any event hotly contested in the climate journals. It is likely that sea level will rise over the coming century or two at a rate no greater than the 1 m per 600 years observed by tide-gauges since 1900. That rate is slow enough to allow ready and inexpensive adaptation almost everywhere.
Lord Monckton was an expert reviewer for the IPCC’s Fifth Assessment Report (2013), and contributes papers on climate sensitivity and climate economics to the learned and specialist journals.
References
Balmaseda MA, Trenberth KE, Källen E (2013) Distinctive climate signals in reanalysis of global ocean heat content. Geophys. Res. Lett. 40(9):175401759. doi: 10.1002/grl.50382
Banholzer S, Donner S (2014) The influence of different El Nino types on global average temperature. Geophys Res Lett 41:2093–2099. doi: 10.1002/2014GL059520
Bournay E (2007) Atlas Environnement du Monde Diplomatique, Le Monde Diplomatique, Paris.
Cazenave A, Dominh K, Guniehut S, Berthier E, Llovel W, Rmillien G, Ablain M, Larnicol G (2009) Sea level budget over 2003-2008: a re-evaluation from GRACE space gravimetry, satellite altimetry and Argo. doi: 10.1016/j.gloplacha.2008.10.004
Cheng L, Zheng F, Zhu J (2014a) Distinctive ocean interior changes during the recent climate hiatus. Geophys Res Lett: submitted
Cheng L, Zhu J (2014) Uncertainties of the ocean heat content estimation induced by insufficient vertical resolution of historical ocean subsurface observations. J Atm Oceanic Tech 31: 1383–1396 Cheng L, Zhu J, Cowley R et al (2014b) Time, probe type, and temperature variable bias corrections to historical expendable bathythermograph observations. J Atm Oceanic Tech 31: 1793–1825 Chung CE, Cha H, Vilma T, Räisänen P, Decremer D (2013) On the possibilities to use atmospheric reanalyses to evaluate the warming structure of the Arctic. Atmos. Chem. Phys. 13: 11209-11219. doi: 10.5194/acp-13-11209-2013
Colorado University (2014) Global mean sea-level time series (seasonal signals removed), http://sealevel.colorado. edu/content/2014rel4-global-meansea- level-time-series-seasonal-signalsremoved: accesed October 2014. Cowtan K, Way RG (2014) Coverage bias in the HadCRUT4 temperature series and its impact on recent temperature trends. Quart. J. R. Met. Soc. B. 140(683): 1934-1944. doi: 10.1002/qj.2297
de Jode, G (1578) Speculum Orbis Terrarum, Antwerp
Ehn M, Thornton JA, Kleist E, Sipilä M, Junninen H, Pullinen I, Springer M, Rubach F, Tillmann R, Lee B, Lopez- Hilfiker F, Andres S, Acir I-H, Rissanen M, Jokinen T, Schobesberger S, Kangasluoma J, Kontkanen J, Nieminen T, Kurtn T, Nielsen LB, Jrgensen S, Kjaergaard HG, Canagaratna M, Dal Maso M, Berndt T, Petäjä T, Wahner A, Kerminen V-M, Kulmala M, Worsnop DR, Wildt J, Mentel TF (2014) A large source of low-volatility secondary organic aerosol. Nature 506:476- 479. doi: 10.1038/nature13032
Dong L, Zhou T (2014) The formation of the recent cooling in the eastern tropical Pacific Ocean and the associated climate impacts: a competition of global warming, IPO and AMO. J. Geophys. Res. doi: 10.1002/2013JD021395
England MH, McGregor S, Spence P, Meehl GA, Timmermann A, Cai W, SenGupta A, McPhaden MJ, Purich A, Santoso A (2014) Recent intensification of wind-driven circulation in the Pacific and the ongoing warming hiatus. Nature Clim. Change 4: 222- 227. doi: 10.1039/nclimate2106
Estrada F, Perron P, Martinez-Lopez B (2013) Statistically derived contributions of diverse human influences to twentiethcentury temperature changes. Nat Geosci 6: 1050–1055. doi:10.1038/ngeo1999
Fyfe JC, Gillet NP, Zwiers FW (2013) Overestimated global warming over the past 20 years. Nature Clim. Change 3: 767-769. doi: 10.1038/Nclimate1972
GISS, 2014, Monthly global mean land and sea surface temperature anomalies, 1880-2014, http://data.giss. nasa.gov/gistemp/tabledata_v3/GLB. Ts+dSST.txt. Accessed 1 July 2014
Glaze Wyatt M, Curry JA (2013) Role for Eurasian Arctic shelf sea ice in a secularly varying hemispheric climate signal during the 20th century. Clim. Dyn. 42(9-10): 2763-2782
Guemas V, Doblas-Reyes FJ, Andreu-Burillo I, Asif M (2013) Retrospective prediction of the global warming slowdown in the past decade. Nature Clim. Change 3:649- 653. doi: 10.1038/nclimate1863
Hansen J (2008) Climate target is not radical enough – study: The Guardian, London, April 7, http://www. theguardian.com/environment/2008/ apr/07/climatechange.carbonemissions: accessed October 2014.
Hansen J, Sato M, Kharecha PK, von Schuckmann K (2011) Earth’s energy imbalance and implications. Atmos. Chem. Phys. 11:13421-13449. doi: 10.5194/acp-11-13421-2011
Haywood J, Jones A, Jones GS (2014) The impact of volcanic eruptions in the period 2000-2013 on global mean temperature trends evaluated in the HadGEM2- ES climate model. Atmos. Sci. Lett. 15(2): 92-96. doi: 10.1002/asl2.471
Huber M, Knutti R (2014) Natural variability, radiative forcing and climate response in the recent hiatus reconciled. Nat Geosci 7: 651–656. doi:10.1038/ngeo228
IPCC (1990) Climate Change – The IPCC Assessment (1990): Report prepared for Intergovernmental Panel on Climate Change by Working Group I. Houghton JT, Jenkins GJ, Ephraums JJ (eds) Cambridge University Press, Cambridge, New York, Melbourne
IPCC (1995) Climate Change 1995 – The Science of Climate Change: Contribution of WG1 to the Second Assessment Report. Houghton JT, Meira Filho LG, Callander BA, Harris N, Kattenberg A, Maskell K (eds) Cambridge University Press, Cambridge, New York, Melbourne
IPCC (2001) Climate Change 2001: The Scientific Basis. Contribution of Working Group I to the Third Assessment Report of the Intergovernmental Panel on Climate Change. Houghton JT, Ding Y, Griggs DJ, Noguer M, van der Linden PJ, Dai S, Maskell K, Johnson CA (eds) Cambridge University Press, Cambridge, New York, Melbourne
IPCC (2007) Climate Change 2007: The Physical Science Basis. Contribution of Working Group I to the Fourth Assessment Report of the Intergovernmental Panel on Climate Change, 2007. Solomon S, Qin D, Manning M, Chen Z, Marquis M, Avery KB, Tignor M, Miller HL (eds) Cambridge University Press, Cambridge, New York, Melbourne
IPCC (2013) Climate Change 2013: The Physical Science Basis. Contribution of Working Group I to the Fifth Assessment Report of the Intergovernmental Panel on Climate Change. Stocker TF, Qin D, Plattner G-K, Tignor M, Allen SK, Boschung J, Nauels A, Xia Y, Bex V, Midgley PM (eds). Cambridge University Press, Cambridge, New York, Melbourne
Johannessen OM, Khvorostovsky K, Miles MW, Bobylev LP (2005) Recent Ice-Sheet Growth in the Interior of Greenland, Science 310:5750, 1013- 1016. doi: 10.1126/science.1115356
Kaufmann RK, Kauppi H, Stock JH (2011) Reconciling anthropogenic climate change with observed temperature 1998-2008. PNAS 108(29): 11790- 11793. doi: 10.1073/pnas.1102467108
Kosaka Y, Xie SP (2013) Recent globalwarming hiatus tied to equatorial Pacific surface cooling. Nat 501: 403–407. doi:10.1038/nature12534 Kühn T, Partanen A-I, Laakso A, Lu Z, Bergman T, Mikkonen S, Kokkola H, Korhonen H, Räisänen P, Streets G, Romakkaniemi S, Laaksonen A (2014) Climate impacts of changing aerosol emissions since 1996. Geophys. Res. Lett. 41(13): 4711- 4718. Doi: 10.1002/2014GL060349
Lovejoy S (2014) Return periods of global climate fluctuations and the pause. Geophys. Res. Lett. 41(13:4704- 4710. doi: 10.1002/2014GL060478 que to Study the Hiatus on the Global Surface Temperature Record. Plos One. doi: 10.1371/journal.pone.0107222
Maher N, Sen Gupta A, England MH (2014) Drivers of decadal hiatus periods in the 20th and 21st centuries. Geophys. Res. Lett. 41(16):5978- 5986. doi: 10.1002/2014GL060527
McGregor S, Timmermann A, Stuecker MF, England MH, Merrifield M, Jin FF, Chikamoto Y (2014) Recent Walker circulation strengthening and Pacific cooling amplified by Atlantic warming. Nature Clim. Change 4:888- 892. doi: 10.1039/nclimate2330
Meehl GA, Arblaster JM, Fasullo JT, Hu A, Trenberth KE (2011) Modelbased evidence of deep-ocean heat uptake during surface-temperature hiatus periods. Nat Clim Ch 1: 360– 364. doi:10.1038/nclimate1229 Meehl, GA, Teng H (2014) CMIP5 multi-model hindcasts for the mid- 1970s shift and early 200s hiatus and predictions for 2016-2035. Geophys. Res. Lett. 41(5):17y11- 1716. doi: 10.1002/2014GL059256
Monckton of Brenchley, CW (2014) It’s Official: Global Warming ‘Pause’ or Standstill extends to over 18 years: global temperature update, http:// www.climatedepot.com/2014/10/03/ its-official-global-warming-pauseor- standstill-extends-to-over-18- years-pause-has-endured-for-a-littleover- half-the-satellite-temperaturerecord: Accessed October 2014.
Morice, CP, Kennedy JJ, Rayner N, Jones PD (2012) Quantifying uncertainties in global and regional temperature change using an ensemble of observational estimates: The HadCRUT4 data set. J. Geophys. Res. 117:D08101. doi:10.1029/2011JD017187
Mörner NA (2011) Sea Level Is Not Rising, Centre for Democracy and Independence, London.
Myers, N. (2005) Environmental refugees, an emergent security issue, 13th Economic Forum of the Organization for Security and Co-operation in Europe, Prague, May.
NCDC, 2014, Monthly global mean land and ocean surface temperature anomalies, 1880-2013, ftp://ftp. ncdc.noaa.gov/pub/data/anomalies/ monthly.land_ocean.90S.90N.df_1901- 2000mean.dat. Accessed 1 July 2014
Neely RR, Toon OB, Solomon S, Vernier J.-P, Alvarez C, English JM, Rosenlof KH, Mills MJ, Bardeen CG, Daniel JS, Thayer JP (2013) Recent anthropogenic increases in SO2 from Asia have minimal impact on stratospheric aerosol. Geophys. Res. Lett. 40. doi: 10.1002/grl.50263
Nerem RS, Chambers DP, Choe C, Mitchum GT (2010 Estimating mean sea-level change from the TOPEX and Jason altimeter missions, Marine Geodesy 33 Supp. 1, 435-446. doi: 10.1080/01490149.2010.491031
Rahimzadeh F, Sanchez-Lorenzo A, Hamedi M, Kruk MC, Wild M (2014) New evidence on the dimming/brightening phenomenon and decreasing diurnal temperature range in Iran (1961-2009). Int. J. Climatol. doi: 10.1002/joc.4107
Risbey J, Lewandowsky S, Langlais C, Monselesan DP, O’Kane TJ, Oreskes N (2014) Nature Clim. Change 4:835- 840. doi: 10.1039/nclimate2310 RSS (2014) Satellite-derived monthly global mean lower-troposphere temperature anomaly dataset: www.remss. com/data/msu/monthly_time_series/ RSS_Monthly_MSU_AMSU_Channel_ TLT_Anomalies_Land_and_Ocean_ v03_3.txt. Accessed 1 July 2014
Santer BD, Bonfils C, Painter JF et al (2014) Volcanic contribution to decadal changes in tropospheric temperature. Nat Geosci 7:185-189. doi: 10.1038/ngeo2098 Schleussner CF, Runge J, Lehmann J, Levermann A (2014) The role of the North Atlantic overturning and deep ocean for multi-decadal global-meantemperature variability. Earth Sys. Dyn. 5:103-115. doi: 10.5194/esd-5-103-2014
Schmidt GA, Shindell DT, Tsigaridis K (2014) Reconciling warming trends. Nature Geosci. 7(158- 160). doi: 10.1038/ngeo2105
Sillmann, J, Donat MG, Fyfe JC, Zwiers FW (2014) Observed and simulated temperature extremes during the recent warming. Environ Res. Lett. 9. doi: 10.1088/1748-9326/9/6/064023
Stauning P (2014) Reduced solar activity disguises global temperature rise, Atmos. Cli. Sci. 4: 60-63. doi:10.4236/acs.2014.41008
Solomon S, Rosenlof KH, Portmann RW, Daniel JS, Davis SM, Sanford TJ, Plattner G-K (2010) Contributions of stratospheric water vapor to decadal changes of global warming. Science 327(5970): 1219-1223. doi: 10.1126/science.1182488
Trenberth KE, Fasullo JT, Balmaseda MA (2014a) Earth’s energy imbalance. J. Clim. 27:3129-3144. doi: 10.1175/JCLI-D-13-00294.1
Trenberth KE, Fasullo JT, Branstator G et al (2014b) Seasonal aspects of the recent pause in surface warming. Nat Clim Ch 4: 911–916. doi:10.1038/nclimate2341
UAH (University of Alabama at Huntsville) (2014) Satellite MSU monthly global mean lower-troposphere temperature anomalies. http://vortex. nsstc.uah.edu/data/msu/t2lt/uahncdc_ lt_5.6.txt. Accessed 1 July 2014
Vecchi GA, Soden BJ, Wittenberg AT, Held IM, Leetmaa A, Harrison MJ (2006) Weakening of tropical Pacific atmospheric circulation due to anthropogenic forcing. Nature 441: 73-76. doi: 10.1039/nature04744.
Watanabe M, Shiogama H, Tatebe H, Hayashi M, Ishii M, Kimoto M (2014) Contribution of natural decadal variability to global warming acceleration and hiatus. Nat Clim Ch 4: 893–897. doi:10.1038/nclimate2355
Wunsch C, Heimbach P (2014) Bidecadal thermal changes in the abyssal ocean. J Phys Oceano 44: 201 3–2030


 (263 votes, average: 4.81 out of 5)


Leave your response!