| GIS | |
Oil spills pollution
|
||||||||
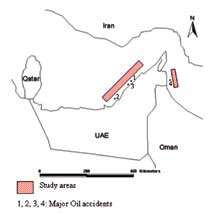
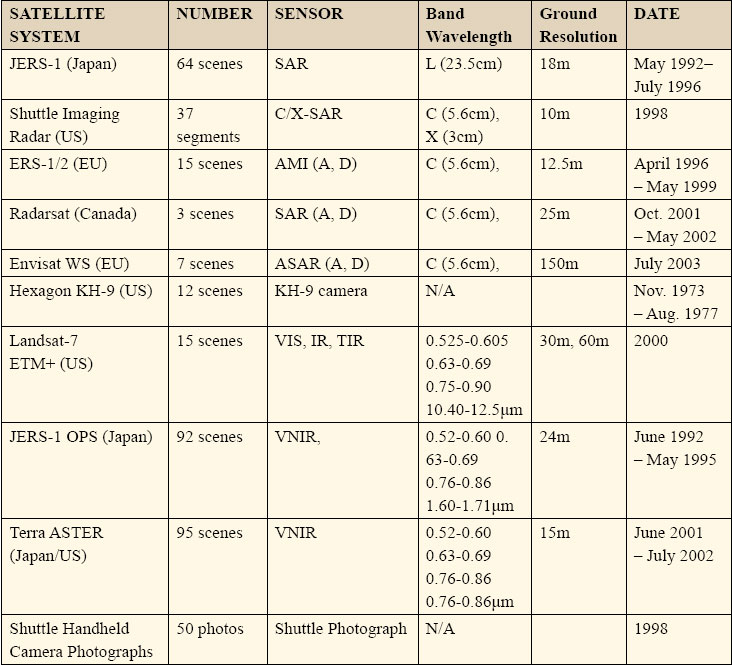
Study areasThe study areas are situated in the Arabian Gulf. -It is a shallow sea with its long axis oriented in NW-SE direction, and its average water depth is about 36m. The Evaporation and wind are the main driving forces for water circulation in the Arabian Gulf. Evaporation is stronger in winter due to high wind speed, than summer when the water surface temperature is higher. The overall circulation in the inner Arabian Gulf is cyclonic, with relatively fresh water entering through the Strait of Hormuz. MethodologyMore than 300 satellite images have been examined during this study (Table 2). ERS-1/2, RADARSAT, and ENVISAT Cband SAR data has been used for the great majority of oil spill detection operations. However, other satellite images including optical sensor images have shown good detection capabilities. Therefore, we looked for all available image data archives and selected more than one hundred images derived from different platforms that covered most of the offshore waters of the UAE. We conducted a search of ERS-1 and 2 data archives to compile a list of all images acquired over the study areas. To evaluate their suitability for slick detection, historical wind conditions for corresponding SAR images were obtained. For each acquisition date, surface wind speed histories were reconstructed using historical records. Results and discussionThe manual interpretation results indicate that certain coastal areas of the UAE face frequent oil spills. Striking examples of oil slicks are shown on figure 2, offshore Fujairah (centered at the coordinates 25o30’N/56o25’E). Here considerable spill concentrations have been found within successive JERS- 1 OPS, Landsat-7 ETM+ images and ERS-1/2 SAR browse images. Figure 2 compares images from 29 June 1992, 21 May 1995 and 28 May 2000 for the same area of offshore Fujairah. Oil discharged from both anchored and moving vessels can be observed in each image. Immediately after discharging flush ballast water, the simmering water surface can be seen as bright silver to gray colour patches on the surrounding water. Based on the size of the image pixel, most of the vessels are super tankers whose hull is more than 300 m in length. Figure 1: Demonstration Study Areas. Remarkable Oil accidents in the Gulf region Table 2: Satellite imagery investigated during the study project |
||||||||
Pages: 1 2


 (No Ratings Yet)


Leave your response!