| Mapping | |
New paradigm in mapping: A critique on cartography and GIS
This paper argues for a new paradigm in mapping, based on fractal or living geometry and Paretian statistics, and – more critically – on the new conception of space, conceived and developed by Christopher Alexander, that space is neither lifeless nor neutral, but a living structure capable of being more living or less living |
 |
|
“Two important characteristics of maps should be noticed. A map is not the territory it represents, but, if correct, it has a similar structure to the territory, which accounts for its usefulness. If the map could be ideally correct, it would include, in a reduced scale, the map of the map; the map of the map, of the map; and so on, endlessly, a fact first noticed by Royce.” Alfred Korzybski (1933)
Abstract
As noted in the epigraph, a map was long ago seen as the map of the map, the map of the map, of the map, and so on endlessly. This recursive perspective on maps, however, has received little attention in cartography. Cartography, as a scientific discipline, is essentially founded on Euclidean geometry and Gaussian statistics, which deal with respectively regular shapes, and “more or less similar things”. It is commonly accepted that geographic features are not regular and that the Earth’s surface is full of fractal or scaling or living phenomena: “far more small things than large ones” at different levels of scale. This paper argues for a new paradigm in mapping, based on fractal or living geometry and Paretian statistics, and – more critically – on the new conception of space, conceived and developed by Christopher Alexander, that space is neither lifeless nor neutral, but a living structure capable of being more living or less living. The fractal geometry is not limited to Benoit Mandelbrot’s framework, but towards Christopher Alexander’s living geometry and based upon the third definition of fractal: A set or pattern is fractal if the scaling of “far more small things than large ones” recurs multiple times. Paretian statistics deals with “far more small things than large ones”, so it differs fundamentally from Gaussian statistics, which deals with “more or less similar things” essentially. Under the new paradigm, I make several claims about maps and mapping: (1) Topology of geometrically coherent things – in addition to that of geometric primitives – enables us to see a scaling or fractal or living structure; (2) Under the third definition, all geographic features are fractal or living, given the right perspective and scope; (3) Exactitude is not truth – to paraphrase Henri Matisse – but the living structure is; and (4) Töpfer’s law is not universal, but scaling law is. All these assertions are supported by evidence, drawn from a series of previous studies. This paper demands a monumental shift in perspective and thinking from what we have used to on the legacy of cartography and GIS.
1. Introduction
Euclidean geometry has served as the foundation of cartography, ever since human beings began to measure the magnitude of the Earth, if not even earlier (Robinson et al. 1995, Slocum et al. 2008, Anson and Ormeling 2013). We cartographers tend to see geographic features individually rather than holistically, non-recursively rather than recursively; we tend to focus on individual scales rather than on all scales or the underlying scaling hierarchy ranging from the smallest to the largest (Jiang and Brandt 2016); we tend to believe in – consciously or subconsciously – “more or less similar things”, as reflected in Tobler’s law (Tobler 1970), rather than “far more small things than large ones”, which is formulated as scaling law (Jiang 2015a). This Euclidean geometric perspective is so stubborn that makes some maps or mapping – for example automatic map generalization – difficult or virtually impossible. A cartographic curve is traditionally viewed as a collection of more-or-less similar line segments – a non-recursive perspective. From a recursive perspective, a cartographic curve consists of “far more small bends than large ones”, and small bends are embedded in large ones (Jiang and Brandt 2016). Inspired by the living geometry of Christopher Alexander (2002–2005), a cartographic curve is a coherent whole, in which nested bends constitute coherent sub-wholes at different levels of scale.
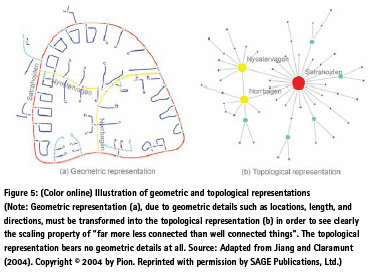
In general terms, geographic features look regular only at a local scale, but they are essentially irregular; geographic features look “more or less similar” only at one scale (Note: the scale means size rather than map scale), but there are essentially “far more small geographic features than large ones”. This notion of “far more smalls than larges” recurs multiple times, indicating a scaling hierarchy of numerous smallest, a very few largest, and some in between the smallest and the largest. However, the scaling hierarchy is quite well hidden in various representations of geographic information systems (GIS), such as raster and vector (Bian 2007, Goodchild 2018). These geographic representations, based on mechanistically imposed geometric primitives of pixels, points, lines, and polygons, are unable to reveal the true scaling property of geographic features; see more discussions in Section 4.1. This mechanistic thinking is limited, for the mechanistically imposed geometric primitives do not correspond to what we perceive about geographic features (c.f. Figure 5 for an illustration). Thus with the mechanistic thinking, we cannot effectively see the fractal or living nature of geographic features. Instead we only see fragmented geometric primitives as equivalent to geographic features. I am, therefore, advocating a paradigm shift in cartography and GIS.
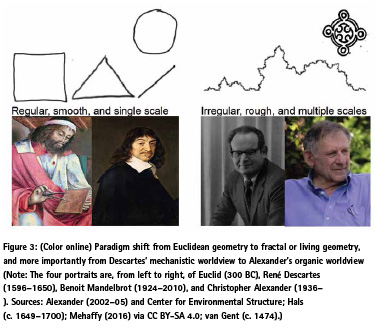
This paper intends to discuss with cartographers, both senior and young, on fractal geometric and Paretian statistical thinking, and – more fundamentally – on the new organic view of space: space is neither lifeless nor neutral, but a living structure capable of being more living or less living. For this purpose, I have attempted to write in an accessible manner so that both academics and practicing cartographers understand my arguments of the new paradigm in mapping. I am calling for a paradigm shift from Euclidean to fractal geometry, and from Gaussian to Paretian statistics, and – more importantly – from the mechanistic thinking of Descartes (1637, 1954) to the organic thinking of Alexander (2002–2005). In order to see scaling or fractal or living structure clearly, we must shift our mentality from geometric details of locations, sizes, and directions to overall character through topology; that is, the topology of coherent geometric entities such as rivers, cities, streets, buildings, and even tiny ornaments. The overall character refers to the underlying scaling or fractal or living structure of “far more smalls than larges”.
I argue that all geographic features are fractal or scaling, given the right perspective and scope. A tree is surely fractal, but we hardly see the fractal nature if concentrating only on the scale of individual leaves (Note: I am not referring to sub-scales of the leaves, which are likely to be fractal), which tend to be “more or less similar” in terms of size and shape. Similarly, with the non-recursive perspective, one can only see fragmented pieces rather than an interconnected whole. Sierpinski (1915) carpet is fractal when seen as a whole, but we hardly see the fractal nature if viewing it fragmentally, as the disconnected squares. The same applies for traditional and vernacular building façades: they are definitely fractal, because there are “far more small things than large ones”, and small things are embedded in the large ones recursively. However, we must take the recursive perspective in order to see the fractal property. I further argue that exactitude is not truth, to paraphrase Matisse (1947) in art, with supporting evidence from science (Borges 1946) and in particular big data (Mayer-Schonberger and Cukier 2013). I further discuss Töpfer’s law (Töpfer and Pillewizer 1966) and argue why it is not universal.
The remainder of this paper is structured as follows. Section 2 reviews three definitions of fractal, especially the third one in terms of statistics and geometry. Section 3 argues for a new paradigm in mapping based on the new cosmology – a new world view or new view of space – conceived and developed by Christopher Alexander (2002–2005), that the real world is an unbroken whole, and that space is neither lifeless nor neutral, but a living structure capable of being more living or less living. Drawing on previous studies, Section 4 further elaborates on the implications of the new paradigm for maps and mapping and geospatial analysis. Section 5 concludes this paper and calls for a healthy debate on cartography and GIS.
2. Three definitions of fractal
The fractal geometry I refer to in this paper goes beyond the framework set by Benoit Mandelbrot (1982), and based on the third definition of fractal: A set or pattern is fractal if the scaling of “far more small things than large ones” recurs multiple times or with ht-index being at least three (Jiang and Yin 2014). This is a very relaxed definition compared to the first two, which require a power law relationship between scales and details, either strictly or statistically – that is, y = x ^ α – where α is called the power law exponent. Three definitions to be introduced represent different ways of thinking. With the first definition, scientists (e.g. Koch 1904) were puzzled by something that is not measurable, so the second definition addressed the question of how long a coastline is (Mandelbrot 1967). Instead of the how long question, the third definition attempted to ask how complex a fractal is (Jiang and Yin 2014). The most important implication for the third definition is that not only naturally occurring, but also human-made geographic features such as streets and buildings are fractal, given the right perspective and scope (c.f. Section 4.2).
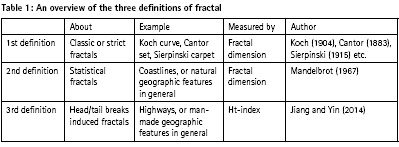
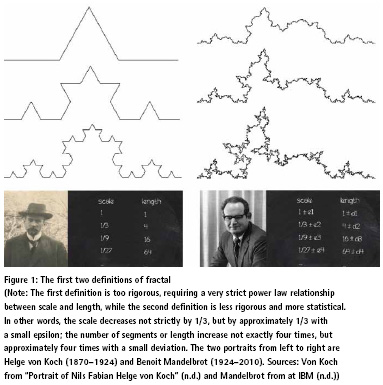
The first definition is the strictest among the three and it dates back to the 19th century, when there were such fractals as Cantor (1883) dust, Koch (1904) curve, and Sierpinski (1915) carpet (Table 1). Let us use the Koch curve – named after its inventor Swedish mathematician Helge Von Koch (1870–1924) – as a working example to illustrate the first definition. It requires a power law relationship or a constant ratio between two parameters, x and y, on their logarithmic scales, that is, y = x ^ -1.26, or equivalently ln(y) = -1.26 ln(x), where x and y indicate the scale and the number of segments, respectively. A segment of one unit is divided into three equal thirds, and the middle one is replaced by the two sides of an equilateral triangle (see Figure 1 for Iteration 1 or the generator). This process of division and replacement is iterative, which means that scale decreases exponentially by one-third: 1, 1/3, 1/9, and 1/27, and the number of segments increases exponentially by four times: 1, 4, 16, and 64. Mathematically, if one variable decreases exponentially and another increases exponentially, these two variables would constitute a power law relationship, i.e., y = x ^ -1.26. Shown in the power law plot, the set of points such as (1, 1), (1/3, 4), (1/9, 16), and (1/27, 64) are exactly on the trend line. This is where the problem arises. When scale is decreased to an infinite short, the length of the curve would become infinitely long. This is the so-called conundrum of length (Richardson 1961, Perkal 1966), which puzzled scientists for over 100 years until the French mathematician Benoit Mandelbrot (1967, 1982) established fractal geometry. Under the framework of Euclidean geometry, anything should be measurable, no matter how big or small it is. In fact, this is a limitation of Euclidean geometry.
The second definition is less strict or more relaxed than the first one. Mandelbrot (1967) noticed that the first definition of fractal is too rigorous for the Koch curve to be a meaningful model of the real world. As a matter of fact, there is no need for scale to decrease by exactly one-third or to have the number of segments to increase by exactly four times, to retain the power law relationship. In other words, with a decrease of scale of approximately one third and an increase in the number of segments of approximately four times, the power law relationship still holds, not exactly but only approximately or statistically (Figure 1). On the power law plot, a set of points, such as (1 ±e1, 1 ± d1), (1/3 ± e2, 4 ± d2), (1/9 ± e3, 16 ± d3), and (1/27 ± e4, 64 ± d4) (where ei and di indicate some very small epsilons or deviations), are around the trend line rather than on the trend line as in the first definition (Ma and Jiang 2018). The resulting curves look very natural, such as clouds, city skylines, and coastlines, dramatically different from the rigorous Koch curve. This shift from the first to second definition of fractal is probably another example for supporting the statement that exactitude is not truth in science (see further details in Section 4.3), because the second is more relaxed or less rigorous than the first.
The third definition is further less strict or more relaxed than the first two. Neither Koch curves nor coastlines are measurable, and their lengths depend on the measuring scale; the shorter the measuring scale, the longer the curves. For complex curves like coastlines, what matters is not how long they are, but how complex they are. “How long” is an unanswerable question, the one that concerns Euclidean geometry or simple science in general, whereas “how complex” is an answerable question that concerns fractal geometry or complexity science in general (Jiang and Ma 2018). The first two definitions are top-down in nature; for example, given a line segment of one unit, and the generator, a fractal curve is generated iteratively. In other words, the generator is applied iteratively again and again, at increasingly fine scales. Eventually, very convoluted and very complex curves are generated. In contrast to the first two definitions, the third definition is not constrained by the power law relationship. Instead, it examines, given a set or pattern, whether the scaling of “far more small things than large ones” recurs multiple times (Jiang and Yin 2014). These multiple times or the ht-index would answer the “how complex” question about the set or pattern. The new paradigm is actually to confront or to address the issue of “how complex”; more specifically, maps and mapping must reflect the underling complex, scaling, fractal, or living structure of the Earth’s surface.
To further illustrate the third definition, let us examine the 100 numbers that exactly and strictly follow Zipf’s law (1949): 1, 1/2, 1/3, …, and 1/100. The average of the 100 numbers is 0.05, which partitions these numbers into two parts: the first 19 numbers (about 20 percent, all greater than the average, called the head), and the last 81 numbers (about 80 percent, all less than the average, called the tail). The average of the first 19 numbers is 0.19, which again partitions the 19 numbers into two parts: the first five (25 percent, all greater than the second average, called the head); and the remaining 14 (75 percent, all less than the second average, called the tail). The average of first five numbers is 0.46, which partitions the five numbers into two parts: the first two (40 percent in the head) and the remaining three (60 percent in the tail). This recursive process is called head/tail breaks (Jiang 2013a, 2015c). The head/tail breaks process continues recursively or iteratively three times or the scaling of “far more small numbers than large ones” recurs three times, implying four hierarchical levels for these 100 numbers; that is, [0.01, 0.05], (0.05, 0.19], (0.19, 0.46], (0.46, 1]. The number of recurrent times is called the ht-index – an alternative index to fractal dimension for characterizing the complexity of fractals or geographic features in particular (Jiang and Yin 2014). The notion of “far more small things than large ones” is also well reflected in the four hierarchical levels. There are 81, 14, 3, and 2 numbers, respective to the four levels from the lowest to the highest. The ratio of upper class to lower class is always a minority to a majority; that is, 14/81, 3/14, and 2/3, which reflects the underlying scaling hierarchy of “far more smalls than larges”.
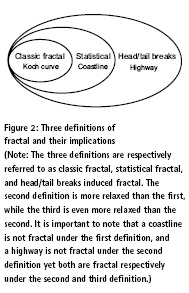
The notion of “far more smalls than larges” must be comprehended not only statistically, but also in terms of the underlying geometry (or spatial configuration to be more precise). Assuming the 100 numbers are 100 city sizes, their distribution over a region of space follows the scaling hierarchy, characterized by the central place theory (CPT) (Christaller 1933, 1966, Chen and Zhou 2006). The CPT model implies that large cities are surrounded or supported by medium-sized cities, which are further surrounded or supported recursively by small cities, forming a scaling hierarchy. This geometric aspect indicates that cities are adapted each other or that nearby cities are “more or less similar”. This adaptation can also be seen from Tobler’s law (1970), which states that nearby things (or cities in particular) tend to be “more or less similar”. Therefore, the third definition of fractal involves both statistical and geometric aspects. This definition implies that not only coastlines but also highways are fractal (Figure 2). As mentioned at the outset of this paper, a cartographic curve should be more correctly viewed as a collection of recursively defined bends, and recurrent scaling of “far more small bends than large ones”. However, highways are not fractal under the first two definitions, since they tend to be smooth or regular. The third definition of fractal, which is more towards living geometry (Alexander 2002–2005), provides a theoretical basis to support a new paradigm in cartography.
3. The new paradigm in cartography
A new paradigm occurs in science when the basic concepts and experimental practices of a scientific discipline undergo a drastic revision. More than just replacing techniques, a paradigm shift means an entirely new way of looking at the real world (Kuhn 1970). The new paradigm in cartography is essentially built on the new cosmology – the conception of physical reality – conceived by Christopher Alexander through his life’s work: The Nature of Order: An essay on the art of building and the nature of the universe (Alexander 2002–2005), a four-volume opus on art, science, nature, and beauty (c.f. Alexander 2003 for a short summary of the masterful work for a scientific audience.). Under the new cosmology, space is unlike what we were told under the mechanistic framework (Descartes 1637, 1954) as being lifeless or neutral, but a living structure capable of being more living or less living. For example, the Koch curves are living structure; those in the high iterations are more living than those in the low iterations; or equivalently, those in the low iterations are less living than those in the high iterations. This new organic world view or new cosmology (Alexander 2002–2005, Book 1, p. 96) is built directly on the wholeness that is defined as follows: “I propose a view of physical reality which is dominated by the existence of this one particular structure, W, the wholeness. In any given region of space, some subregions have higher intensity as centers, others have less. Many subregions have weak intensity or none at all. The overall configuration of the nested centers, together with their relative intensities, comprise a single structure. I define this structure as ‘the’ wholeness of that region.”
The wholeness is a recursive structure that is defined mathematically, and exists physically in nature and in what we build and make (Alexander 2002–2005, Jiang 2015d, 2016, 2019b). The recursive structure recurs at different levels of scale in the deep; it is so deep that “each time it occurred, it took a different form, and was yet, nevertheless always the same” (Alexander 2006). Under the new cosmology or the world picture, the Earth’s surface is considered to be an unbroken whole. A map eventually reflects the truth of the wholeness of the Earth’s surface or part of it. Thus, the truth, or capturing the truth, should be the essence of all mapping activities. Given the circumstance, quality of maps is a matter of fact rather than personal preferences or opinions, as commonly conceived.
The above definition of wholeness can be simply rephrased as the scaling hierarchy of “far more smalls than larges”. Space or geographic space in particular is neither lifeless nor neutral, but a living structure. When I say it is neither lifeless nor neutral, I am not saying that geographic space is not dynamic along the time dimension. Instead, I am saying that at any instant in time, geographic space is not neutral and it has the capacity of being more living or less living. We need to adopt a holistic view in order to see the capacity of geographic space. The scaling hierarchy cannot be effectively characterized by Euclidean geometry, but it can by fractal geometry (Mandelbrot 1983), particularly the fractal geometry – or living geometry – under the third definition: A set or pattern is fractal if the scaling of “far more small things than large ones” recurs multiple times with the ht-index being at least three (Jiang and Yin 2014). It is important to realize the paradigm shift from Descartes’ mechanistic world picture to Alexander’s organic conception of the physical world (Figure 3).
The living geometry of Alexander (2002–2005) is more profound than the fractal geometry of Mandelbrot (1982) for characterizing the Earth’s surface.
On the one hand, the Earth’s surface is a whole and it is part of a larger whole, and so on endlessly towards the entire universe. On the other hand, the Earth’s surface contains countries, which further contain cities, streets, and buildings, down to the architectural scale of millimeters (e.g., to see the living structure of an ornament). The wholeness of the Earth’s surface is what the new paradigm is largely based on, and it is what maps attempt to depict. To this point, I wish to correct a statement I made in the early 1990s: visualization as the core of cartography. No, visualization cannot be the core of cartography, and it is just appearance. The core of cartography is the deep structure of the wholeness, or the fractal or scaling or living structure of geographic space. Maps and mapping, such as visualization, symbolization, map generalization, and even cognitive mapping, should reflect the wholeness or the scaling hierarchy of “far more smalls than larges”.
In addition to the new cosmology, emerging geospatial big data adds another incentive for the new paradigm in cartography. Big data differs fundamentally from small data in terms of three data characteristics (Mayer- Schonberger and Cukier 2013, Jiang and Thill 2015). First, big data is considered to be all rather than samples. Second, big data are accurately measured at a very high resolution, while small data are at a low resolution or roughly estimated. Third, big data are defined at the individual scale rather than aggregated as small data. These three characteristics imply that big data are better than small data in reflecting the wholeness of the Earth’s surface, which tends to be very heterogeneous and diverse. The heterogeneity and diversity cannot be well seen in raster and vector representations of GIS, since they are based on geometric primitives of pixels, points, lines, and polygons (Bian 2007, Goodchild 2018), which tend to be “more or less similar” rather than “far more smalls than larges”; see Figure 5 for an illustration. Instead, we should take spatially or geometrically coherent entities as basic units, e.g., named or natural streets as shown in Figure 5, and assess how they constitute a coherent whole, from which sub-wholes can be identified. A coherent whole emerges from a holistic perspective, or more truly from its spatial configuration point of view.
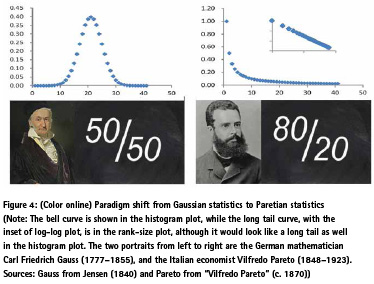
This new paradigm requires shifting our ways of thinking, not only geometrically (Figure 3) but also statistically (Figure 4). The third definition of fractal is based on the notion of “far more smalls than larges”, indicating actually a Paretian distribution. It is not the bell curve shown in histogram, but a long tail in the rank-size plot (Zipf 1949). This long-tailed distribution can be shown to have hierarchical levels through head/tail breaks (Jiang 2013a, 2015c). Under the new paradigm, different types of mapping can be considered the head/ tail breaks process for thematic mapping, for map generalization, for cognitive mapping, and even for perception of beauty (Jiang 2013a, 2013b, Jiang et al. 2013, Jiang and Sui 2014, Jiang 2015b). This beauty is a new kind of beauty that exists in deep structure – structural beauty – out of the deep structure of wholeness (Jiang and Sui 2014). The new paradigm implies that cartography should go beyond conventional GIS representations towards topological representations that enable us to see the underlying scaling or fractal or living structure of the wholeness of the Earth’s surface. I will further discuss this implication and others in the next section.
4. Implications of the new paradigm in cartography
The new paradigm has some deep implications for cartography and GIS and for mapping and geospatial analysis in particular. Under the new paradigm, a map would become the truth of the wholeness of the Earth’s surface, and mapping processes of various kinds should be largely guided by the scaling law (Jiang 2013b, Jiang 2015a, 2015b). In general terms, cartography is a science – the one based on the complexity science, e.g., fractals, scaling hierarchy, and living structure, just to mention a few examples. Under the new paradigm, conventional mathematics such as Euclidean geometry and Gaussian statistics remain valid for measuring and analysing geographic objects with respect to Tobler’s law or to the notion of “more or less similar things”, but are unlikely to be of much use for developing new insights with respect to spatial heterogeneity or scaling law.
4.1 Topology matters for seeing a scaling or fractal or living structure
The foundation of the new paradigm is the organic world picture, from which geographic space – or space in general – is viewed as a scaling or fractal or living structure. In order to see this living structure clearly, we must adopt a topological perspective – the topological relationship among geometrically coherent entities such as rivers, lakes, streets, and buildings. Conventional GIS are essentially based on a geometric perspective, focusing on geometric details of locations, sizes, and directions, and based on geometric primitives of pixels, points, lines, and polygons (Bian 2007, Goodchild 2018). In this regard, a street network is a very good example. A street network is conventionally seen as a graph of street nodes or street segments (Figure 5a). Structurally speaking, the graph to the left is very homogeneous with characteristic scales, since each node or street segment has “more or less similar” number of connections. Three or four can be said to be a characteristic scale of the node’s connectivity; all segments have “more or less similar length”, which can be said to be another characteristic scale. Traditional mathematical description and quantitative analyses are essentially based on characteristic scales.
In fact, the street network can be more truly seen as a graph of individual streets, defined, for example, by unique names. This is the topological perspective, with which we can see “far more short streets than long ones” geometrically, or “far more less-connected streets than wellconnected ones” topologically. Thus, streets constitute a fractal or living structure. It should be noted that not only streets but also street blocks – the space between all streets – are fractal, since they involve “far more small blocks than large ones” (Jiang and Liu 2012). This is in line with the notion that if a pattern or set is fractal, and its complement set tends to be also fractal (Chen 2017).
The transformation from the geometric representation to the topological representation ignores the geometric details. This is because an entire street has been abstracted as one node and, more importantly, this node has no geometric information at all except its topological information such as degrees of connectivity. Many researchers (e.g., Ratti 2004) mistakenly argued that the topological representation suffers from the loss of geometric information, so it is of less use than the geometric representation. This is indeed an extremely biased, prejudiced, and blinkered view. In fact, it is exactly through the ignorance (rather than loss) of geometric information that the topological representation gains penetrating insights into the underlying scaling structure of “far more lessconnected streets than well-connected ones”. Geometrically, a street network is not fractal, but topologically it is. The topological representation is considered to be the first and foremost, while the geometric one is just secondary. In other words, we don’t give up the geometric representation entirely, and we only give up our devotion to it, since there is something more important – the topology – than the geometry.
4.2 All geographic features are fractal or living
Under the third definition, all geographic features are fractal or living, given the right perspective and scope. We have already seen in Section 4.1 that topology among meaningful geographic features is the right perspective for seeing the fractal or living structure of a street network. As for the scope, it is usually the case that bigger is better for seeing fractal or living. For example, a country is better than a city to see fractal, a city is better than a building, a building is better than a façade, and a façade is better than an ornament. However, as a matter of fact, fractal or living structure can be seen at different levels of scale. These examples can be extended to biology. A human body is better than an organ to see fractal, an organ is better than a tissue, and a tissue is better than a cell. In summary, the larger the scope, the more heterogeneous or more diverse the things are.
Given that all geographic features are fractal, we must adopt the head/tail breaks (Jiang 2013a, 2015c, Lin 2013) for classification and visualization rather than the commonly used the natural breaks or k-means or other classifications (Jenks 1967). For example, any digital elevation model (DEM) involves “far more low elevations than high ones”. Current color rendering for DEM unconsciously exaggerates high elevations (Figure 6, Panel (a)), so it distorts – rather than reflects – the underlying fractal or living structure. Using the head/tail breaks, the DEM should have rendered as in Panel (b). Panels (a) and (b) look very different, but Panel (b) reflects well the underlying scaling or fractal or living structure of “far more low elevations than high ones. This difference can be seen clearly in the two corresponding histograms in the figure, with one showing a Gaussian-like distribution, and the other a long tail distribution.
4.3 Exactitude is not truth
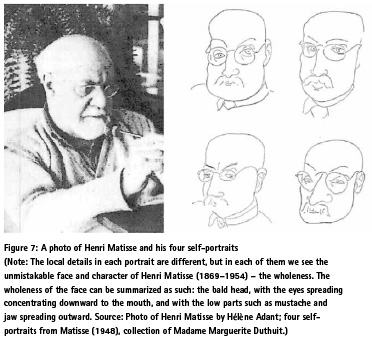
The title of the subheading is borrowed from the artist Henri Matisse (1947), who made some very cogent statements about his art. Matisse (1947, p. 117) noted that the overall character of a human face does not depend on “the exact copying of natural forms, nor on the patient assembling of exact details, but on the profound feeling of the artist before the objects which he has chosen, on which his attention is focused and the spirit of which he has penetrated”. Figure 7 illustrates the scene while Matisse was drawing his four self-portraits, as seen in a mirror. These four portraits differ from each other in terms of local details of the nose, chin, and eyes, yet they all look unmistakably like the face and character of Henri Matisse.
The artist argued that everything has an inherent truth that must be distinguished from its surface appearance, and this is the only truth that matters. He noticed that it is essentially truth of an object that makes a drawing or painting successful. Christopher Alexander (2002–2005) claimed that the truth is what he termed the wholeness. The wholeness exists physically in space and matter at different levels of scale, and reflects in our minds and cognition psychologically. More importantly, the wholeness is essentially a recursive structure that can be mathematically defined (Alexander 2002–2005, Jiang 2015d, 2016, 2019b).
Contrary to the assertion that exactitude is not truth, our desire for exactitude in GIS and cartography has become higher and higher. Cartographers or GIS experts in general are fond of high-resolution imagery and high-quality data in maps or GIS databases. This situation is understandable given that cartography is essentially founded on Euclidean geometry, and its initial goal was to depict the underlying structures or patterns of geographic space through scientific abstraction. Such a depiction requires high exactitude in terms of locations, sizes, and directions. In this regard, many different map projections were developed for different purposes of measurement and navigation (Yang et al. 1999). All of these achievements constitute the legacy of cartography (Bian 2007, Goodchild 2018), and have been well retained in GIS.

Cartography has been facing an important change from data collection to knowledge discovery. The past six decades of GIS history have experienced two major distinct phases of transformation: the transformation from data to information, and the transformation from information to knowledge. The former phase concerns data collection – transforming raw data into computerized information, whereas the latter is more interested in how to obtain useful information or knowledge for various spatial planning and decision making. The Euclidean geometric paradigm works well in the first phase, but it has critical limitations in the second phase. Back to Figure 7 again, the photo has the highest data quality – similar to the person in appearance, whereas the four portraits capture the highest data or personal character – similar to the person in character. The difference between similar to the person in appearance and in character is what underlies the notion of “exactitude is not truth”.
The issue of exactitude or overall data character has been discussed not only in art, but also in science. The Argentine writer Jorge Luis Borges (1946) wrote a one paragraph story entitled “On exactitude in science”. The story, styled as an extract from a historic travel book dating on 1658 by the fictitious author Suarez Miranda, praised the value of abstraction or reduced scales of maps instead of maps of 1:1 scale. Maps of 1:1 scale are useless due to their lack of abstraction or generalization. Privileging more data of less exactitude opens new ways for big-data analytics: “We don’t give up on exactitude entirely; we only give up our devotion to it. What we lose in accuracy at the micro level we gain in insight at the macro level” (Mayer- Schonberger and Cukier 2013, p. 13–14). The topological representation as discussed in Section 4.1 provides another good example regarding the fact that exactitude is not truth. Geometric details actually prevent us from seeing the truth – the underling scaling or fractal or living structure.
4.4 Töpfer’s law is not universal, while scaling law is
Töpfer’s law, also called the principle of section or radical law (Töpfer and Pillewizer 1966), provides a guideline for how many map objects should be selected or retained from the source map to the derived map. It is an empirical law, developed through counting the number of map objects in both the source and derived maps. This way of establishing the empirical law was justified at the paper map ages, when maps were mainly produced by human cartographers. However, the law was established through individual map sheets, which are artificially and mechanistically determined. Each of these determined map sheets is not a whole or sub-whole. A whole is referred to something natural or organic rather than something mechanical or artificial. For example, the Earth’s surface is a whole, and a continent is a sub-whole; if a country is referred to as a whole, then its cities are sub-wholes; if a human body is a whole, then the heart or brain is a sub-whole.
Many natural objects like mountains, rivers and streets may stretch across several map sheets, and are not constrained to any one of them. Therefore, one cannot effectively count the number of objects. Some objects, like settlements or buildings, are countable, but belong to individual clusters, which cannot be effectively detected or counted in map sheets. In this regard, it would be reasonable to take a country as a whole, and its individual cities as sub-wholes, and so on. Or, if possible, take the entire world as a whole, and individual countries and cities as sub-wholes, and sub-wholes of the sub-wholes. All in all, the topological perspective rather than ordinary geometric perspective, as discussed in Section 4.1, helps us to see whole or sub-wholes. Scaling law is essentially built on this holistic view of space, and the notion of “far more smalls than larges” recurs at different levels of scale. Therefore, scaling law is universal, while Töpfer’s law is not.
There are two basic functions of maps: for reading detailed individual information and for illustrating overall scaling patterns. For the reading function, maps are presented conventionally with a detailed map legend, map scale, and a compass. For the function of showing scaling patterns, map elements such as legend, scale and compass are unnecessary or less important (e.g., Figure 5b and 6b). The latter function is in line with fractal geometry focusing on patterns rather than individuals.
Cartography is a true science. I therefore suggest change the wording in the definition of cartography from “the art, science and technology of making maps …” (Meynen 1973) to “the science, art, and technology of making maps …”. First and foremost, cartography is a science, and the art is for the sake of science, to paraphrase Mandelbrot (1989). The art or the artistic aspect arises from the underlying scaling or fractal or living structure rather than something subjective or idiosyncratic (Griffin 2017). The fractal or living structure can evoke a sense of beauty – structural beauty that can be measured quantitatively, as well as sensed by human beings (Jiang and Sui 2014, Jiang 2015d, Wu 2015, Rofé 2016). A beautiful map must reflect the underlying living structure, which accounts for a majority of beauty, while aspects of surface beauty such as colour and design account for a minority.
5. Conclusion
Arguing for a new paradigm in mapping, this paper provides a critical analysis of the state of the art of cartography and GIS: its stubborn Euclidean geometric and Gaussian statistical thinking, and – more fundamentally – its deadly mechanistic thinking, as reflected in many GIS representations such as raster and vector. This new paradigm is established on the new organic cosmology (Alexander 2002–2005) that the universe is a coherent unbroken whole, and space is neither lifeless nor neutral, but a living structure capable of being more living or less living. Affected by modernism, postmodernism, and deconstructionism, so called fashionable nonsense (Sokal and Bricmont 1998), a map is considered not to be the truth. Contrary to this claim, I argue that a map, if correct, is essentially about the truth of the wholeness of geographic space – the essence of the argument for the new paradigm – and quality of maps is a matter of fact rather than that of opinion. I call for a paradigm shift, from Euclidean geometry to fractal geometry, and from Gaussian statistics to Paretian statistics, and – more importantly – from the mechanistic thinking of Descartes (1637, 1954) to the organic thinking of Alexander (2002–2005). I have presented three definitions of fractal and discussed how one definition gets relaxed – actually beyond – one after another, yet open new horizons to see our surrounding things insightfully. The third definition is unique in the sense that it enables us to see things organically rather than mechanistically. The new paradigm may raise discomfort in the profession, but, it nevertheless opens new ways of thinking that are highly challenging to the academic establishment of cartography and GIS.
The new paradigm has some profound implications on cartography and GIS, and for mapping practices and geospatial analysis in particular. It implies that mapping, including cognitive mapping, can be considered to be a head/tail breaks process (Jiang 2013b). It implies that the topological perspective rather than the perspective focusing on geometric details enable us to see the scaling or fractal or living structure of the Earth’s surface or its sub-wholes. It implies that all geographic features are fractal under the new, relaxed third definition of fractal. It implies that the wholeness of the earth’s surface relies little on geometric details, but on the overall character – the very notion of “far more smalls than larges”. It implies that a map is the truth of the wholeness of the Earth’s surface, and cartography is a true science. I hope that this paper can help promote healthy debates in departments of cartography and GIS, and in the cartographic community as a whole, about the legacy and future of cartography and GIS.
Acknowledgement
This paper is a reprint of the original paper (Jiang 2019a), reprinted with permission from University of Toronto Press (https:// utpjournals.press). I would like to thank the anonymous reviewers, the editor-inchief of the journal, Emmanuel Stefanakis, and Kenneth Carling, Antoni Moore, Ferjan Ormeling, and Terry Slocum for their useful comments. This paper is based on a series of keynote lectures, through which I called for new ways of thinking in cartography and geographic information science. The most relevant lectures are “Challenging the establishment of cartography and GIS”, “A geospatial perspective on sustainable urban mobility in the era of big data”, “Why topology matters in spatial cognition and analysis”, “Why should scaling be the first law of geography”, and “Why should spatial heterogeneity be formulated as a scaling law”, which were presented on various occasions such as CSUM 2018: Conference on Sustainable Urban Mobility, 24-25 May, 2018, Skiathos Island, Greece; COSIT 2017: Conference On Spatial Information Theory, 4-8 September 2017, L’Aquila, Italy; GIS Väst: Annual Conference on the Sustainable City, 15 November 2016, Goteborg, Sweden; and the 8th International Forum on Spatial Integrated Social Sciences and Humanities, 23 June 2017, Nanjing, China. The latest presentation is available here http://tiny.cc/049mdz.
Note by the author
Under the new paradigm, we have developed a fully automatic solution to map generalization (Jiang 2018). This solution starts from a single largest-scale database (e.g., 1:1K). All subsequent small-scale maps or databases can be automatically derived. This automatic process is determined by the data, so called data speak for itself. On the other hand, it is possible to integrate the user’s requirements to provide customized results. The small scales include not only primary scales, such as 1:2K, 1:4K, 1:8K, …, 1:4M, and conventional discrete scales, such as 1:2.5K, 1:5K, 1:10K, …, 1:4M, but also any arbitrary scales, such as 1:2.345K, and 1:9.843K. In other words, this solution is able to produce maps or databases of continuous map scales, from which we choose over 10 scales for comparing our results (to your right screen) with those of OpenStreetMap (to your left screen) of Sweden as a case study of MapGEN: http://lifegis.hig.se/Sweden/
References:
Alexander C. (2002–2005), The Nature of Order: An essay on the art of building and the nature of the universe, Center for Environmental Structure: Berkeley, CA.
Alexander C. (2003), New Concepts in Complexity Theory: Arising from studies in the field of architecture, an overview of the four books of The Nature of Order with emphasis on the scientific problems which are raised: http://natureoforder.com/ library/scientific-introduction.pdf
Alexander C. (2006), Empirical findings from the nature of order, Environmental and Architectural Phenomenology, 18(1), 11–19.
Anson R. W. and Ormeling F. J. (2013), Basic Cartography for Students and Technicians, Elsevier: Amsterdsam.
Bian L. (2007), Object-oriented representation of environmental phenomena: Is everything best represented as an object? Annals of the Association of American Geographers, 97(2), 267–281.
Borges J. L. (1946), On exactitude in science, In: Borges J. L. (1998), Collected Fictions, Translated by A.
Hurley, Penguin Books: New York, 325.
Cantor G. (1883), Über unendliche, lineare punktmannigfaltigkeiten, Mathematische Annalen, 21, 545–591.
Chen Y. G. (2017), Fractal analysis based on hierarchical scaling in complex systems, In: Fernando Brambila (editor, 2017), Fractal Analysis: Applications in Health Sciences and Social Sciences, InTechOpen: Rijeka, 141–164.
Chen Y. G. and Zhou Y. (2006), Reinterpreting central place networks using ideas from fractals and self organized criticality, Environment and Planning B, 33(3), 345-364.
Christaller W. (1933, 1966), Central Places in Southern Germany, Prentice Hall: Englewood Cliffs, N. J.
Descartes R. (1637, 1954), The Geometry of Rene Descartes, translated by Smith D. E., and Latham M. L, Dover Publications: New York
Goodchild M. F. (2018), Reimagining the history of GIS, Annals of GIS, https://doi. org/10.1080/19475683.2018.1424737.
Griffin A. L. (2017), Cartography, visual perception and cognitive psychology, Routledge: London.
Jenks G. F. (1967), The data model concept in statistical mapping, International Yearbook of Cartography, 7, 186–190.
Jiang B. (2013a), Head/tail breaks: A new classification scheme for data with a heavy-tailed distribution, The Professional Geographer, 65 (3), 482–494.
Jiang B. (2013b), The image of the city out of the underlying scaling of city artifacts or locations, Annals of the Association of American Geographers, 103(6), 1552–1566.
Jiang B. (2015a), Geospatial analysis requires a different way of thinking: The problem of spatial heterogeneity, GeoJournal, 80(1), 1–13. Reprinted in Behnisch M. and Meinel G. (editors, 2017), Trends in Spatial Analysis and Modelling: Decision- Support and Planning Strategies, Springer: Berlin, 23–40.
Jiang B. (2015b), The fractal nature of maps and mapping, International Journal of Geographical Information Science, 29(1), 159–174.
Jiang B. (2015c), Head/tail breaks for visualization of city structure and dynamics, Cities, 43, 69–77. Reprinted in Capineri C., Haklay M., Huang H., Antoniou V., Kettunen J., Ostermann F., and Purves R. (editors, 2016), European Handbook of Crowdsourced Geographic Information, Ubiquity Press: London, 169–183.
Jiang B. (2015d), Wholeness as a hierarchical graph to capture the nature of space, International Journal of Geographical Information Science, 29(9), 1632–1648.
Jiang B. (2016), A complex-network perspective on Alexander’s wholeness, Physica A: Statistical Mechanics and its Applications, 463, 475–484. Reprinted in Ye X. and Lin H. (2019, editors), Advances in Spatially Integrated Social Sciences and Humanities, Higher Education Press: Beijing.
Jiang B. (2018), Methods, apparatus and computer program for automatically deriving small-scale maps (A granted United States Patent WO 2018/116134, PCT /I B2017 /058073) Jiang B. (2019a), New paradigm in mapping: A critique on Cartography and GIS, Cartographica, 54(3), 183–205. https://doi.org/cart.54.3.2018-0019
Jiang B. (2019b), Living structure down to earth and up to heaven: Christopher Alexander, Urban Science, 3(3), 96, https://www.mdpi.com/2413-8851/3/3/96
Jiang B. and Brandt A. (2016), A fractal perspective on scale in geography, ISPRS International Journal of Geo-Information, 5(6), 95; doi:10.3390/ijgi5060095e
Jiang B. and Claramunt C. (2004), Topological analysis of urban street networks, Environment and Planning B: Planning and Design, 31(1), 151–162.
Jiang B. and Liu X. (2012), Scaling of geographic space from the perspective of city and field blocks and using volunteered geographic information, International Journal of Geographical Information Science, 26(2), 215– 229. Reprinted in Akerkar R. (2013, editor), Big Data Computing, Taylor & Francis: London, 483–500.
Jiang B. and Ma D. (2018), How complex is a fractal? Head/tail breaks and fractional hierarchy, Journal of Geovisualization and Spatial Analysis, 2, 1–6, DOI: 10.1007/s41651-017-0009-z.
Jiang B. and Sui D. (2014), A new kind of beauty out of the underlying scaling of geographic space, The Professional Geographer, 66(4), 676–686.
Jiang B. and Thill J.-C. (2015), Volunteered geographic information: Towards the establishment of a new paradigm, Computers, Environment and Urban Systems, 53, 1–3.
Jiang B. and Yin J. (2014), Ht-index for quantifying the fractal or scaling structure of geographic features, Annals of the Association of American Geographers, 104(3), 530–541.
Jiang B., Liu X. and Jia T. (2013), Scaling of geographic space as a universal rule for map generalization, Annals of the Association of American Geographers, 103(4), 844–855.
Koch H. V. (1904), Sur une courbe continue sans tangente, obtenue par une construction géométrique élémentaire, Arkiv for Matematik, 1, 681–704.
Korzybski A. (1933), On Structure, In: Korzybski A. (1994), Science and Sanity: An Introduction to Non-Aristotelian Systems and General Semantics (fifth edition), Institute of General Semantics: Brooklyn, New York, 54–65.
Kuhn T. S. (1970), The Structure of Scientific Revolutions, second edition, enlarged, The University of Chicago Press: Chicago.
Lin Y. (2013), A comparison study on natural and head/tail breaks involving digital elevation models, A Bachelor Thesis at University of Gävle, Sweden: http://www.diva-portal.org/smash/get/ diva2:658963/FULLTEXT02.pdf
Ma D. and Jiang B. (2018), A smooth curve as a fractal under the third definition, Cartographica, 53(3), 203–210.
Mandelbrot B. B. (1967), How long is the coast of Britain? Statistical self similarity and fractional dimension, Science, 156 (3775), 636–638.
Mandelbrot B. B. (1982), The Fractal Geometry of Nature, W. H. Freeman and Co.: New York.
Mandelbrot B. B. (1989), Fractals and an art for the sake of science, Leonardo, 2, 21–24.
Matisse H. (1948), Exactitude is not truth, In Henri Matisse: Retrospective Exhibition of Paintings, Drawings and Sculpture, ed. Philadelphia Museum of Art, trans. E.R. Clifford, 33–34. Philadelphia: Philadelphia Museum of Art.
Matisse H. (1947), Exactitude is not truth, in: Flam J. D. (1978, editor), Matisse on Art, E. P. Dutton: New York, 117–119.
Mayer-Schonberger V. and Cukier K. (2013), Big Data: A revolution that will transform how we live, work, and think, Eamon Dolan/Houghton Mifflin Harcourt: New York.
Mehaffy M. (2016), The Architect Christopher Alexander in 2012, Available from https://commons.wikimedia.org/ wiki/File: ChristopherAlexander2012.jpg
Meynen E. (1973), Multilingual Dictionary of Technical Terms in Cartography, International Cartographic Association: Stuttgart.
Perkal J. (1966), On the length of empirical curves, Discussion Paper No. 10, Ann Arbor, Mf: Michigan inter- University Community of Mathematical Geographers, translated by W. Jackowski from Julian Perkal, 1958, Dtugosci Krzywych Empirycznych, Zastoswania Matematyki, HL 3–4: 258–283.
Ratti C. (2004), Space syntax: some inconsistencies, Environment and Planning B: Planning and Design, 31(4), 501–511.
Richardson L. F. (1961), The problem of contiguity: An appendix to statistic of deadly quarrels, General systems: Yearbook of the Society for the Advancement of General Systems Theory, Society for General Systems Research: Ann Arbor, Mich., 6(139), 139–187
Robinson A. H., Morrison J. L., Muehrcke P. C., Kimerling A. J., and Guptill S. C. (1995), Elements of Cartography (6th Edition), Wiley: New Jersey.
Rofé Y. (2016), The meaning and usefulness of the “feeling map” as a tool in planning and urban design, in Pontikis K. and Rofé Y. (editors, 2016), In Pursuit of a Living Architecture: Continuing Christopher Alexander’s quest for a humane and sustainable building culture, Common Ground Publishing: Champaign, Illinois.
Sierpínski W. (1915), Sur une courbe dont tout point est un point de ramification, Comptes rendus hebdomadaires des séances de l’Académie des Sciences, 160, 302-305.
Slocum T. A., McMaster R. B., Kessler F. C., and Howard H. H. (2008), Thematic Cartography and Geovisualization (3rd Edition), Pearson: Essex, UK.
Sokal A. and Bricmont J. (1998), Fashionable Nonsense: Postmodern intellectuals’ abuse of science, Picador: New York.
Tobler W. (1970), A computer movie simulating urban growth in the Detroit region, Economic geography, 46(2), 234–240.
Töpfer F. and Pillewizer W. (1966), The principles of selection, The Cartographic Journal, 3(1), 10–16.
Wu J. H. (2015), Examining the new kind of beauty using the human being as a measuring instrument, A Master Thesis at University of Gävle, http:// hig.diva-portal.org/smash/get/ diva2:805296/FULLTEXT01.pdf
Yang Q, Snyder J., and Tobler W. (1999), Map Projection Transformation: Principles and Applications, CRC Press: London.
Zipf G. K. (1949), Human Behaviour and the Principles of Least Effort, Addison Wesley: Cambridge, MA


 (9 votes, average: 4.44 out of 5)


Leave your response!