| Mapping | |
Maps: Changing approach
Web 2.0 allows small amateur mapmaker to produce maps that can almost immediately be published to promote and support their cause |
|
 |
|
|||||
With the wide access to relatively inexpensive or freeware computer software for map production and using the Internet and the World Wide Web (Web) for dissemination this process has been automated somewhat, enabling the production of products and (Web) publishing to be fairly straight-forward. Using the Web as a publishing medium has allowed these relatively small voices to disseminate their viewpoint, which might otherwise be impossible if only conventional media could be utilised. Most recently using social media and Web-map Application Programmatic Interfaces (APIs), under the ‘umbrella’ of what has come to be called Web 2.0 (O’Reilly, 2005), provides a conduit whereby information and maps can readily be produced and made available, globally.
This paper looks at how movements for environmental protection now use Web-maps and other geospatial artefacts to disseminate their message. In the past various graphics and maps were developed, mainly in-house by amateur cartographers, to represent the information pertinent to environmental issues. Due to the very nature of the organisations, which, in many cases are staffed by volunteers, the maps produced have been produced by non-experts and generally printed on paper for subsequent distribution – until relatively recently. Now, with access to a wide range of geospatial products published via Web 2.0 software these organisations can be better informed.
Web 2.0
Web 2.0 was described as:
“… the transformation of the original Web of static documents into a collection of pages that still look like documents but are interfaces to full-fledged computing platforms. These Web-based services are proliferating so fast because they can be built using shared, standardized programming tools and languages developed, for the most part, by open-source software community” (Roush, 2005, p. 49).
It has been made possible by three broad technology trends:
• Inexpensive Internet access;
• Inexpensive wireless computing devices; and
• The Web as a platform for personal publishing and social software (Roush, 2005)
About Web 2.0, O’Reilly (2004) coined a term «architecture of participation» to describe the nature of systems that are designed to encourage user contribution. Therefore, with Web 2.0 users make their own contributions, they share documents and they are attuned and skilled at composing their own compilations of rich media to facilitate ‘self-help’ information provision. Web 2.0 is basically about the use of Social software for ‘personal publishing’ via Blogs (personal electronic ‘journals’ built online using sites like Blogger, LiveJournal, Movable Type and WordPress (Roush, 2005)), retrieve collaboratively assembled information resources (including geospatial resources) using Wikis (Web sites that allow the free posting of un-moderated content that is continually reviewed and modified by contributors – eg. Wikipedia (http://www.wikipedia.org), and, for mapping, publish maps via mash-ups.
Web 2.0 and cartography
Web 2.0 presents a new view on what can be done when provisioning users with cartographic materials. It is a different way of delivering cartographic media which, in many cases is basically non-cartographic, but delivers information that needs to be spatially defined and controlled if us-able geographical information is to be assembled. Maps are being enhanced by the use of social software to make them more affective, so as to personalise them and to thus impart more usable and pertinent information. This will rely on ‘pulling’ resources from the Web and also having Web resources ‘pushed’ to users via software like RSS (Really Simple Syndication) readers.
Perhaps the main issue for cartography is the fact that now the amateur map publisher is now a map provider as well as traditional publishers. Collaboration via Web 2.0 allows users to produce maps as mash-ups, which combine already available maps and satellite imagery (for example from Google Maps© or Google Earth©) and overlay their own data. Base maps or satellite imagery is ‘mashed’ together with pre-existing geospatial artefacts. Mash-ups allow maps to be produced by mixing services delivered through a third party using a publicly accessible and usable interface or an API, Perhaps the most widely-used mapping application is that provided by Google Maps©. It provides base maps of almost anywhere that can be used as an ‘underlay’ for individual annotation with default symbols or specially-created symbology. Map views are available as topographic or street maps (perhaps the most widely used maps are street maps), imagery (satellite or aerial), hybrid (maps plus imagery) and street (360 degree views of some locations). They allow user-producers to generate information overlays and map annotations that could be described as ‘geo-notes’.
Case Study – Environmental movements in Australia
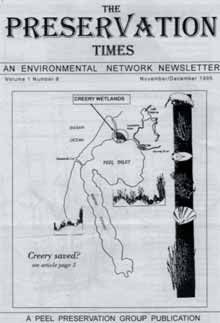
In Australia many Environmental protection movements depend on volunteer-produced publications, with included maps to accompanying articles. They were produced ‘in-house’ and had a ‘homespun’ look, even in the mid-1990s. An example is shown below – the Preservation Times – an “Environmental Network Newsletter”. An example of a map from this publication is provided in Figure 1.
Fig 1. Source: http://www.green.net.au/ppg/creerywetlands.html
Historically, these maps were prepared by hand-drawn techniques and replicated by printing. Later, publications, were probably produced using DeskTop Publishing (DTP) tools and multiple copies made using relatively inexpensive processes like photocopying. The production of the maps was hampered by the availability of graphics production tools or software. This could result in products that, when evaluating the ‘look’ of maps compared to their commercially-generated counterparts, appeared to be inferior. New and available tools were needed for map production and publication. Web 2.0 provides a method for collaborative publishing using Social Software that enables amateur cartographers to produce professional products. This method for map publishing is covered next.
Social media and map publishing Perhaps the best products of this genre are Google Maps© and GoogleEarth©. Both products enable maps and 3-dimensional drawings to be produced on-line. Both Google products have generated an enormous interest in Web-delivered geographical information. Google Maps© grew by 51.57% in 2007 and the site received almost 90,000,000 unique visitors in 2007, up from around 60,000,000 in 2006 (Techcrunch, 2007).
Web 2.0 and maps to support movements
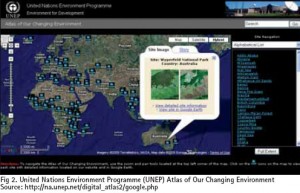
International and national organisations have embraced Web 2.0 for map publishing. It has enabled them to produce high-quality graphics to promote their particular cause. One international example is the United Nations Environment Programme (UNEP) Atlas of Our Changing Environment (Figure 2).
This atlas uses Google Earth© as an underlay for depicting environmental changes. Users can view global information and make international comparisons. As well, individual country and regional information can be viewed by zooming into a particular area of interest. Hot spots then allow interrogation of specific information elements and to open additional pages. The product is a Web-delivered atlas, with base imagery and maps coming from the Google Earth© application. Organisations like UNEP can become almost instant atlas publishers, without the need to build their Web atlas application from scratch. Now looking at Web 2.0 and two Australian movements – Squat Space, a local organization in the Redfern/Waterloo suburb of Sydney and the environmental movement. These two case studies have been chosen for inclusion in the paper, as they illustrate the diverse nature of how Web-map APIs have been used to support the dissemenation of spatially-defined information. Squat Space is a small organization that endeavours to improve the living conditions of this deprived inner city area. At the other extreme is the environmental movement: nationally organized, enthusiastically supported and championing causes that stand against actions that might degrade the quality of Australia’s environment.
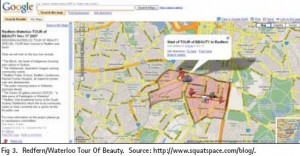
Squat Space organised the Redfern/Waterloo ‘Tour Of Beauty’, an event that invites residents to explore their suburb, so as to better understand the elements that constitute where they live and also to provide an opportunity for residents to get to know each other. Advertising for the event began with the distribution of a paper map, and accompanying literature asked residents interested in participating in the Tour of Beauty to return the map, with their location of domicile marked. Once this information was returned and collated the Tour was planned and advertised. This was done using Google Maps© (Figure 3).
This example shows how local resident action movements can better promote and organise their activities using Web 2.0. The maps produced as part of the Tour of Beauty supported information communication in a manner that was more effective than conventional ‘print and post’ methods. Wider scale applications of map publishing with Web 2.0 is described in the following sections.
The Anti-logging movement in Australia involves many active organizations. One major concern in Australia is inappropriate logging of prime forests, with little influence from the general public about what happens. Because timber harvesting occurs in remote areas the problem, for many, was that the actual logging activities were “out of sight out of mind”. Massive tracts of forest were being removed, causing untold devastation to the environment. For example, each year in the Australian State of Tasmania, approximately 15,000 hectares of native forest are destroyed. (The Wilderness Society, 2006).
Information about what would happen is hard to get for an interested citizen. Areas designated for felling need to be identified on ‘formal’ governmental publications like appendices to Acts (maps) or to make educated speculations, supported by official forest reserve maps. But, for information seekers who might be inexpert at map resource research they will remain uninformed or ill informed without the means to track-down pertinent information. How can they discover “what’s happening”?
Small organizations rely on making information available by taking governmental maps, scanning and cropping the information needed about a particular logging area and then making this information available through their Web site. Typical of these small organisations is the Dingo Creek anti rainforest logging organisation (http://www. geco.org.au/2005/dingock05.htm). It works to halt logging in the East Gippsland (in the State of Victoria) rainforest by protesting at the forest coup and also undertaking legal proceedings. The organization publishes maps of the coups under threat of logging, or already being logged. The maps are annotated government publications and contain no additional information from the organisation itself. More impact is had from the publication of paper maps (produced with DTP tools) by Australia-wide organizations. They can collect information and then publish their information as maps.
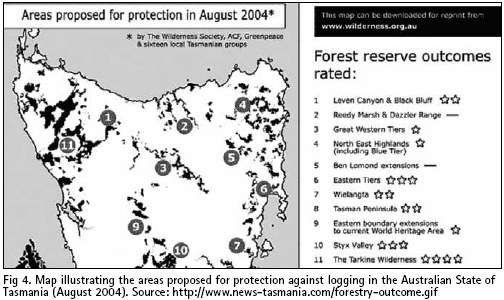
The map shown in Figure 4
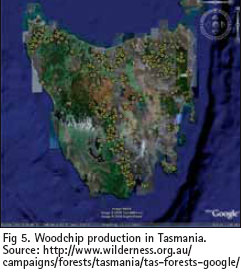
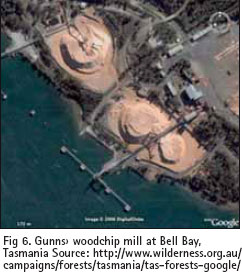
is such a map – produced jointly by the Wilderness Society, The Australian Conservation Foundation and Greenpeace. Now the Wilderness Society uses Google Earth© to show the impact of forest clearing. Its Web site provides immediate information about Australiawide environmental issues. The screen grab shown in Figure 5 illustrates the Society’s pages focusing on logging for woodchip production in Tasmania. The Tasmanian arm of The Wilderness Society and the Victorian Rainforest Network (VRN) produced maps (Figure 5) pinpointing where trees were being harvested, providing clear evidence of the impact of timber harvesting in this State. Google Earth© imagery was also used to highlight the sheer size of woodchipping in the State by including an image of the Gunns› woodchip mill at Bell Bay, Tasmania (Figure 6). It was included in the Wilderness Society Web page that highlighted the impact of clearfell timber harvesting and the eventual use of this natural resource: to produce woodchips for export. Looking further north, in the State of Victoria, clearfell logging was permitted in the Otways until 2008, when all remaining sawlog licences expire. Google Earth© images were generated to illustrate where logging would occur up until this time. The overlays were developed by the Otway Ranges Environmental Group (The Wilderness Society, 2006).
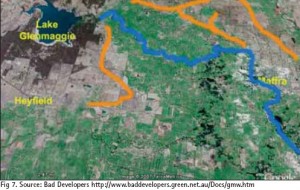
Another organization that monitors environmental matters is Bad Developer. Through its Web site and by utilising Google Maps© and Google Earth© it highlights inappropriate development. Looking at one example of maps published using Google Earth© is in the State of Victoria, where a water supply company, Southern Rural Water, was found to be using Acrolein. Bad Developers exposed the results of this practice. On the mashup shown in Figure 7
the orange shows location of channels sprayed with Acrolein in January and November 2005.
This section has provided some examples of how Google Earth© and Google Maps© have been used to publish maps by an inner city urban movement and environmental organizations for highliting inappropriate development or activities in environmentally sensitive areas. These organizations have found that publishing in this manner is a most effective conduit for their information transmission. They have said: “Google Earth allowed the group to more effectively convey the impact of logging, which had been difficult to do previously as many Tasmanian forest areas were closed off to the public”. «For those people who don›t go out to the forest a lot, it basically unlocks the gates,» … (Moses, 2006).
Changes
Crawford (2006) wrote that computers are being used differently with Web 2.0. This illustrates a shift from the conventional publishing model. She writes: “But what has changed over the past 15 years is that they (the users) no longer represent the only way to produce and distribute creative work. As computing power has become more affordable and software has become more powerful, the creative potential of what can be done at home – and at relatively low cost – has soared. And there has been an explosion of creative production as a response. It has been described as “mass amateurisation”: the masses now have greater access to the means of cultural production. We are witnessing a crucial shift as the gap narrows between what can be done at home and what is professionally produced; amateur productions take on professional approaches and professional productions make use of the amateur aesthetic.” (Crawford, 2006, p. 23). She goes on to say: Everyone is making something, collaborating on something or distributing something. It doesn’t matter if it’s a zine, a new media installation, a piece of software, an album, a short film or a photo blog” (Crawford, 2006, p. 23).
Conclusion
With access to sophisticated computer hardware and software, linked by communications devices that are now readily available, the map-maker’s palette is now richly and extensively provisioned with the means for depicting and delivering renderings of geographical information in a more timely, resourceful and exciting manner. The use of Social Software and Web 2.0 typifies this. Web 2.0 allows small amateur mapmaker to produce maps that can almost immediately be published to promote and support their cause. The use of such technologies and their ability to communicate globally is clear. How best to include emotion in these sandardised look and feel products needs to be addressed if powerful messages are to be delivered.
References
Cartwright, W., Miles, A., Morris, B., Vaughan, L. and Yuille, J., 2008, “Geo-Placed Knowledge: developing a methodology for provisioning stakeholders in natural environments management with integrated media tools”, in Geospatial Vision: New Dimensions in Cartography, A. Moore and I. Drecki (Eds.), Berlin Heidelberg: Springer-Verlag, pp. 220 – 234.
Crawford, K., 2006. Oh grow up!. Edited extract from the book Adult T hemes: Rewriting the Rules of Adulthood, Macmillan Australia, in The Age Good Weekend, September 23, 2006, pp 18–23.
Moses, A., 2006, “Satellite images unlocks extent of logging”, The Age, December 13, 2006. http://www.smh.com.au/news/ web/satellite-images-unlocks-extent-oflogging/ 2006/12/13/1165685727367.html
O’Reilly, T., 2005, “What Is Web 2.0” O’Reilly Network. http://www. oreillynet.com/pub/a/oreilly/tim/ news/2005/09/30/what-is-web-20.html
PC World, 2008, “Google Maps Gaining on MapQuest”, January 2008. http://www.pcworld. com/article/id,141391-pg,1/article.html
Roush, W., 2005. Social machines. MIT Technology Review, Aug 2005, pp. 45 – 53.
Techcrunch, 2007, “2007 In Numbers: iGoogle Google’s Homegrown Star Performer This Year”. http://www.techcrunch. com/2007/12/22/2007 -in-numbers-igooglegoogles- homegrown-star-performer-this-year/
The Wilderness Society, 2006, Tasmania›s devastating logging practices exposed”. http://www.wilderness.org.au/campaigns/ forests/tasmania/tas-forests-google/
My Coordinates |
EDITORIAL |
|
Conference |
Where navigation meets the world, NRSC User Interaction Workshop 2010 |
|
News |
INDUSTRY | GPS | GALILEO UPDATE | LBS | GIS | REMOTE SENSING |
|
Mark your calendar |
APRIL 2010 TO NOVEMBER 2010 |



 (82 votes, average: 1.06 out of 5)


William, I agree with your observations in fact I’m trying to build a business on this model see http://www.numaps.com.au.
Also, mashups are all the buzz right now especially in the breakout spatial community that us ‘spatially aware’ people call the ‘broader community’. There are these mashup competitions on the go and a lot of hype about how mashups can milk the implicit benefits from freely available Government data sets. But what are mashups and what makes them such a hot topic right now.
Mashups in the web development context have been defined in Wikipedia as “a web page or application that combines data or functionality from two or more external sources to create a new service.” There are many variations of these types of applications but in essence its all about allowing the web community to build and publish applications that aggregate spatial and non spatial data in innovative, responsive and open ways – some people refer to this as part of a general movement to democratize the web.
But hang-on you might well say, we have had web mapping for many years and many organizations like Local Governments etc have published their own data for their own constituents via the Internet as part of disseminating information. Some have also integrated third party data as well such as by displaying their own data on top of Google Maps. Others have also taken publically available third party datasets and added to their own data for added richness. So to the GIS community this would seem to be something that we can already do – in fact some in the GIS community actually shudder at the mere mention of the word mashup. So just about any self respecting GIS developer could build a mashup right now with the right incentive and the right data – right? If we ignore all the details about the delivery technologies which quite frankly confuse the debate about what constitutes a real mashup, sure; but there is another aspect to this that we should explore a little more closely.
Right now with the promotion of mashup competitions (with significant prize money), web application (app) programmers from external-to-the-GIS-community have been able to get hold of Government Spatial data and integrate it with GoogleMaps, BingMaps, OpenStreetMap, etc. The Federal Government has supported this and published a website [http://data.australia.gov.au] that facilitates access to a range of different spatial and non spatial data sets via file downloading techniques. The mashup developer needs to download this data, transform it into whatever system they prefer, build their app and publish their app on the Internet for all to use. The mashup developer also makes use of publically available geo-services such as online geocoders/gazetteers, charting services, routing services, etc that add complex functionality in a simple easy to use mashup. This is a novel exercise to the non GIS community and is what constitutes contemporary mashups.
However, mashups are really about bringing data and processes together that are ‘published’ on other people’s resources (web sites). That is, people that build mashups depend on published data resources and/or published geoservices that are accessible via web service requests [ see Service Oriented Architectures]. To take a copy of Government data and then integrate it within your own application is really a perpetuation of the existing web mapping technology/applications that have been in operation now for over 10 years. What really sets the web2.0 mashup world apart is for anyone that builds a mashup app to have web access to a vast array of published spatial and non spatial data sets via open standards. Not to acquire these data from someone else and then publish them as your own, albeit attributed, data sets.
What do we mean by published? Some people assume published means being able to physically acquire the data under Creative Commons and use it in their app. Online publishing is different. It requires providers to have exposed their data/services in a way that is accessible via machine readable webservice requests just like Google and the other base map supplies have done. Both mechanisms can have the same apparent end its just that one is profoundly different than the other. Imagine if you could only get GoogleMaps as a download file(s) or on CDs that you have to integrate into your application! Many Government datasets are already provided in this way [ABS, GA, PSMA, etc]. This would be painful and it would generate replications of different versions of the data. These mashups we see today are using downloaded data from the Government site that is up to date as of a certain point in time. Do we really think these mashup providers want to go and get the data again and update their mashups? In the case of Google they keep their basemap up to date for you even though they too get the data from a government [PSMA] channel because they have a business model that funds and justifies this. The point is that the mashup developer/provider can and should be anyone with minimal infrastructure and actually hosts none of the data their mashup apps need.
Now this is leading into guess what? The need for Governments to urgently publish their raw fundamental data in a way that is discoverable and accessible on the web via open standards such as RSS Feeds, OGC WMS/WFS, KML, etc. These are software readable interfaces that allow mashup developers to access these resources without physically copying these data into their own hosted environments – they just connect to these services as they do with GoogleMaps etc. The organizations that would publish these data resources are usually the custodians/authors which means they have the responsibility to keep them current for all to use – retaining data closest to source. Just imagine how many different versions of the Cadastre, which is just one data layer, there are out their being used given the supply model which is to distribute a new version quarterly – how many people update their Cadastral data bases I wonder? This is a ‘divide and conquer ‘approach to the impossible task of integrating the thousands of spatial data and geo-processing resources and at the same time harnesses the army of applications developers out there that are ready to start building these mashup apps. The potential and benefits are simply unbounded!
This concept is not new just not yet fully or systematically funded/implemented and represents green-fields for our spatial industry – it is what we call a Spatial Data Infrastructure [SDI]. We at NuMaps are publishing an SDI-ready version of the ABS Census data by way of our own online DemographicDrapes that are accessible via OGC webservice requests. Some of our customers are connecting via their own mashups to integrate a select handful of our DemographicDrapes into their services as thematic map overlays. Our own online viewer app [mashup] accesses data from our published OGC service as well as cascading to other OGC published resources and third party suppliers. There are of course commercially/personally sensitive data sets that are not ever to be published but once again mashups can allow the user to over-plot their own excel data thus allowing users to integrate their own data in a private yet convenient way. We at NuMaps are actually looking forward to the availability of an increasing number of published services out there because they reduce our data management overheads, offload processing and deliver most current versions of the data from the custodians.
So mashups are important as they highlight what you can do if you had an SDI in place. But what comes first the chicken or the egg? Without an SDI the potential of the mashup is and will always be stifled. Yet mashups show the potential of what can be done with online Government data. Mashups are the sizzle that hopefully will show the potential and value of Australia establishing a fully operational Spatial Data Infrastructure [the steak]. Then any number of application developers can combine any number of data and geo-services to spatially enable our community in unfathomable ways.
So the real challenge in my mind is not who can build the best, fastest or simplest mashup, although that is the easy thing to do right now and does help fuel demand; but the real challenge is how quickly organizations can publish their data in an SDI-ready way. This will of course require vision, leadership and investment to establish this infrastructure that will be as important to future generations as other infrastructures have been in the past.
Brad Spencer
NuMaps
‘Unleashing Demographics’
http://www.numaps.com.au
Leave your response!