| GNSS | |
Ionosphere TEC anomaly detection prior to Earthquake using GPS observation data
A case study of 2018 Mw 6.2 Tajikistan Earthquake |
 |
|
 |
|
Diurnal Total Electron Content (TEC) variations prior to Mw 6.2 Tajikistan Earthquake of 9th May 2018 were investigated for pre earthquake ionosphere anomaly detection and its relationship vis a vis earthquake epicentre distance. Study was carried out using data from International GNSS service (IGS) stations: KIT3, POL2, TASH and CHUM. The TEC time series prior to earthquake indicates anomalies on 10th April, 16th April, 20th April, and these anomalies become continuous from 5th may to 9th May 2018. TEC anomaly time were detected for each anomalous day and was found to be 7.683 UTC on 10 April 2018, 3.55 UTC and 9.783 UTC on 16 April 2018, 9.617 UTC on 20 April 2018, 16.383 UTC on 5 May 2018, 8.45 UTC on 7 May 2018, 8.4 UTC on 8 May 2018 and 5.983 UTC on 9 May 2018. It was inferred that the closest observation station to epicentre showed higher TEC values from rest of the stations which may be attributed to a definite relationship with the epicentre distance of impending earthquake. It was observed that for positive anomaly TEC concentration increases towards the epicentre and it decreases towards the epicentre in case of negative anomaly. It was also seen that the negative anomaly may be observed in the close proximity of earthquake preparation zone. With increasing distance from the radius of the earthquake epicentre area, magnitude of TEC anomaly decreases in all the cases which was completely analogous to the fact that the maximum anomalous values are observed near to the earthquake epicentre. Hence, it is vital to screen TEC variations constantly utilizing GNSS receivers and peculiar anomalies be considered as one of the important parameter for earthquake precursor detection.
Introduction
The prime factor for earthquake occurrences is deformation of the earth crust and strain accumulation. These deformations have certain manifestations in ground as well as the ionosphere. The ionospheric perturbation can be studied by monitoring the behaviour of Total Electron Content (TEC) at the ionosphere by use of dual frequency GPS receiver. TEC is the total number of electrons present between GPS Satellite and receiver in the earth’s ionosphere. It is measured in TEC unit (TECU), defined as 1 TECU=electrons/ m2. Present study made an attempt to quantify the ionosphere perturbation vis-àvis Tajikistan earthquake for understanding its precursors. Source of the earthquake is of course deformation on the crust that activates the electronic charge carriers known as positive holes giving rise to peroxy defects in the crystals and minerals of crustal rocks (Freund et al., 2009, Freund, 2011). These positive holes leave the electrons and move to the surface as well as unstressed part of the rock. As the positive holes enter the unstressed rock, they repel electrostatically leading to the ionisation of the lower atmosphere. In this process, positive ions are generated that are free to move through the troposphere up to the lower ionosphere where they join with the electrons. Depending upon the process of ionisation, the electrons may either decrease or increase which was studied in present research. As these are initially pulled by positive ions, the process leads to decrease first, followed by increase due to continuous flow of electrons. Laboratory experiments conducted in support of this mechanism (positive holes) suggest that the number of positive ions produced can reach values of the order of 107 sec–1. cm–2 (Freund et al., 2009) indicating regional high concentrations of positive air ions, often lasting tens of hours. This mechanism states that the air at ground level becomes positively ionized, leading to the development of a vertical ion current, which is expected to produce an ionospheric disturbance. Since the ionosphere is a dispersive medium for electromagnetic waves, it induces a time delay in radio signals during the transmission of the GPS satellite signals (Davies, 1990, Garner et al., 2008, Olwendo et al., 2016) that can be estimated by differencing the two frequencies of GPS satellites signals. Thus in present study, total electron content (TEC) values were estimated using dual-frequency GPS receivers.
Numerous study has been carried out to understand the ionosphere TEC variation prior to earthquakes (Calais and Minster, 1998, Liu et al., 2001, Liu et al., 2002, Liu et al., 2004, Pulinets, 2004, Pulinets et al., 2005, Hegai et al., 2006, Pulinets, 2009, Dogan et al., 2011, Liu et al., 2011, Ouzounov et al., 2011, Kumar and Singh, 2012, Yao et al., 2012, Grant et al., 2015, Shah and Jin, 2015, Sharma et al., 2017, Sharma et al., 2017) which indicates TEC as one of the important parameter to be considered in precursor study. It was also shown that the electron density may decreased upto 51% from its typical incentive between 12:00-17:00 LT, that was observed 3 to 4 days prior to event as shown in case of e Chi-Chi earthquake (Liu et al., 2001). In this study, Tajikistan Earthquake of 9th may 2018 was analyzed as an example, the epicentre of which was 32 km North West of Ishkhashim, occurred at 10:41:45 UTC (USGS). The radius of the earthquake preparation zone was estimated as per Dobrovolsky equation (Dobrovolsky et al., 1979) and was found to be 467.70 km. Global Positioning System (GPS) permanent station (IGS Stations) within this zone was identified and selected for analysis in present study. The results showed anomalies in ionosphere TEC variations at regular intervals prior to the event and are discussed in detail.
Methodology and Datasets
Every GNSS observations are inherent with an errors because of the dispersions in the ionosphere, primary cause for which are the electron concentration or Total electron content (TEC) along the line of sight in the ionosphere between the observation station and Navigation satellite (GPS). TEC processing were carried out using GPS-TEC analysis application software (Ma and Maruyama, 2003, Seemala and Valladares, 2011). Slant TEC (sTEC) were computed using both phase and code values for L1 and L2 GPS frequencies in the software in order to eliminate the effect of tropospheric water vapor and clock errors (Sardon et al., 1994, Sardón and Zarraoa, 1997, Arikan et al., 2008). The absolute values of TEC was then obtained by including the differential code and receiver biases from the University of Bern (Valladares et al., 2009). However, for precursor analysis, it is crucial to compute ionospheric variations in vertical direction known as Vertical TEC or vTEC (Pulinets et al., 2005). Therefore, based on the assumption of thin-shell ionosphere at a fixed height, slant TEC is converted into equivalent vertical TEC (Kersley et al., 2004). In the presence of the EIA, there occurs a large spatiotemporal gradient in TEC which poses a great challenge on the accuracy of the TEC owing to the mapping function while converting the slant TEC (STEC) to vertical TEC (vTEC). To minimize this effect in the computed TEC values, an elevation threshold angle of 30° was used for all the vTEC computed.
The geomagnetic storm index (Dst) data from World Data Centre for Geomagnetism and Space magnetism (WDC) were utilised in assessing geomagnetically disturbed day during the TEC observation window. The data used in this research were obtained from the IGS receivers KIT3 (Kitab), TASH (Uzbekistan), POL2 (Kyrgyzstan) and CHUM (Kazakhstan) for the period of April-May 2018 in receiver-independent exchange (RINEX) format. Various statistical analysis were carried out in order to identify the precursors and its signatures as discussed in the result and discussion section. The anomaly in the TEC observations were detected using the statistical approach as below (Sharma et al., 2017, Sharma et al., 2017)
Boundary limit = X ± 1.34σ
Where, X is 15-day running mean and σ is 15 days running standard deviation for particular time of observation. These act as a boundary limit for TEC variations, i.e., TEC values crossing these limits are considered anomaly. Hence, a mathematical model was constructed that give the anomalous behaviour of ionospheric TEC where vTEC must lie between the upper and lower boundary limit in normal ionosphere condition.
Result and Discussion
To have a better understanding of seismic precursor in the Middle East, an attempt was made to analyse the ionospheric TEC anomalies by continuous operating GNSS receivers of International GNSS service (IGS). Since the earthquake is of large magnitude Mw 6.2, anomalous behaviour of TEC is more likely to be expected and are explored in present study. It was seen that TEC variations preceding the Tajikistan earthquake started almost a month prior to event with number of anomalies occurring 0 to 29 days and are discussed in detail in the present section.
TEC anomaly and anomaly time detection
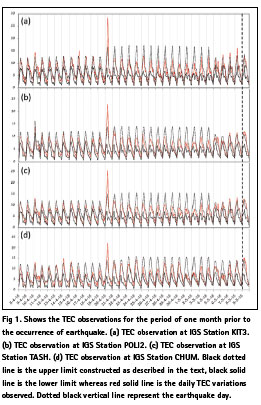
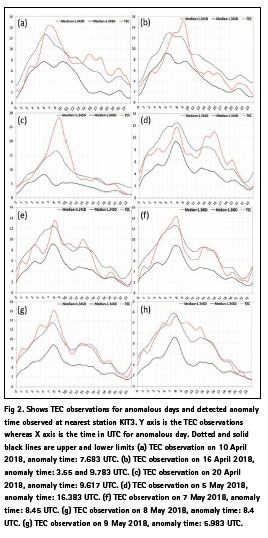
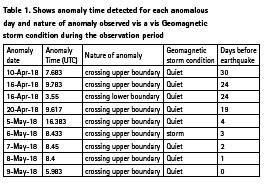
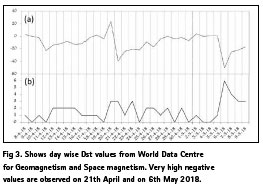
Seismic perturbation on the ionosphere caused by Tajikistan Earthquake of 9th may 2018 were analysed, epicentre of which lies 32 km North West of Ishkhashim and occurred at 10:41:45 UTC. Ionospheric perturbation was studied through TEC monitoring using GNSS observations at IGS stations KIT3, POL2, TASH and CHUM before the earthquake. The TEC time series of month prior to earthquake indicates strong anomalies (crossing upper boundary) on 10th April, 16th April, 20th April, and these anomalies become continuous from 5th may to 9th may (figure 1). Since these values has crossed upper boundary limit, they are named as positive anomalies. Similarly, a negative anomaly (values crossing lower boundary) was seen on 16th April 2018 as shown in figure 1, which is a characteristic feature of earthquake and has also been observed in earlier studies as well (Sharma et al 2017). The anomaly on 16th April is observed by the nearest site (KIT3) only and the magnitude of TEC is also smaller on other stations as compared to KIT3. It is rather interesting to note that all stations showed a positive anomaly on 20th April, 5th May and 9th May (the day of earthquake). In addition, at observation station CHUM, positive anomalies was observed on 14-15th April which was not seen or was minimal in other observation stations. These irregularities observed at CHUM station are attributed to a nearby earthquake of 4.6 magnitude, the epicentre of which was 96 km south of Urzhar, Kazakhstan on 21st May 2018. The time at which the TEC deviation is maximum and minimum was noted and was named as anomaly time. It is also known that a geomagnetic storm can cause significant changes in ionospheric TEC and needs to be assessed to rule out its influence. Three indices give a good measure of geomagnetic storm: Dst index, Ap index, Kp index. In present study, anomalies are checked using Dst data from World Data Centre for Geomagnetism and Space magnetism (WDC). Dst index shows negative values for a geomagnetic storm. A geomagnetic storm is marked by a value crossing -30 unit, where as severe geomagnetic storm is marked by values crossing about -50 unit. Further TEC anomalies for geomagnetic storm was also checked with Kp indices. Kp indices shows positive values crossing 5 unit in the case of geomagnetic storm. Any anomaly observed on day other than that on geomagnetically disturbed day defined by Dst and Kp as discussed above may be seismic in origin and are considered as anomaly. In present analysis Dst index shows values less than -30 on 21 April 2018 and 6th May 2018 which could be the signature for geomagnetic storm (fig 3). The Kp on 6th may 2018 also shows values more than 5 units indication storm. Both positive (crossing upper limit) and negative (crossing lower limit) anomalies were observed on 16th April 2018 and its corresponding anomaly time was 9.783 UTC and 3.55 UTC respectively. The TEC observation for all the anomalous days are shown in figure 2 and the anomaly time detected for these anomalous days are shown in table 1.
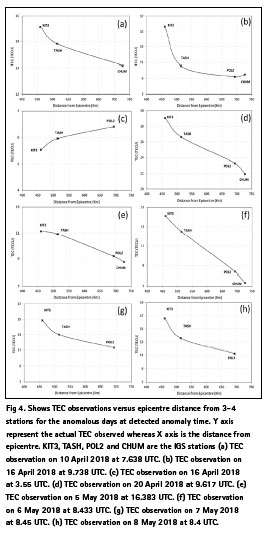
TEC variation with distance from the epicentre
Anomaly observed at different stations on 20th April 2018 showed maximum anomalous behaviour at observation station KIT3, which lies inside the radius of earthquake preparation zone (figure 1). TASH also showed high values in some cases as it lies near to the radius of earthquake preparation zone (40km from KIT3).
A huge decrement was observed in the magnitude of TEC anomaly when moved just 30 km towards TASH and further towards POL2 (i.e., away from epicentre). 7th and 8th May 2018 showed a steep decreasing trend from KIT3 to TASH and slightly linear change between TASH and POL2 observation stations as shown in figure 4. From the plot, it is inferred that the closest observation station (KIT3) to epicentre showed slight higher TEC values from rest of the stations which may be attributed to a definite relationship with the epicentre distance of impending earthquake.
The next closest observation station (TASH) also showed slight higher TEC observation but lower than KIT3 which is expected as both lies close to each other. The rest stations showed minimal variation. Hence a general decreasing trend was observed as we go farther from the epicentre. It was observed that the Tajikistan earthquake of magnitude 6.2 has major effect up to 500 km from the epicentre. Minor effects were seen at 500 to 600 km from epicentre and from 600 km to 700 km, the seismogenic effects was seen minimal. Therefore it is observed that for positive anomaly TEC concentration increases towards the epicentre. Negative anomaly on 16th April 2018 at 3.55 UTC shows completely opposite trend to that of positive anomalies which is rather expected. For negative anomaly, TEC concentration decreases towards the epicentre as shown in figure 4 (c). KIT3 showed very prominent negative anomaly which was not prominent with rest of the stations. This may infer that the negative anomaly may be observed in the close proximity of earthquake preparation zone.
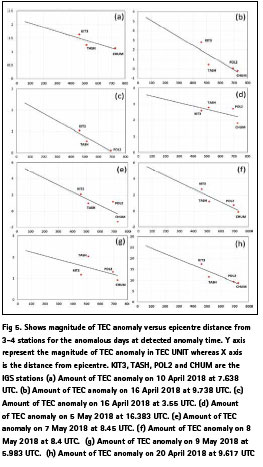
Magnitude of TEC anomaly versus epicentre distance
4 IGS stations data was analysed in making a general relationship of TEC anomaly with respect to the distance from the epicentre. This relationship can explain why it is important to take stations within the preparation zone and give a rough idea about the extent up to which ionosphere can get disturbed due to the impending earthquake of certain magnitude. The relationship was established by computing the TEC anomaly values i.e., TEC minus upper limit in case of positive anomaly and lower limit minus TEC for negative anomaly.
The idea is to compute the magnitude of TEC anomaly as we move towards the epicentre. As the distance of one station to other is not regular, a linear plot is not expected but a general trend must be achieved if the anomaly was of seismic origin. KIT3, TASH and POL2 lies within the earthquake preparation zone where as the fourth station considered in present analysis was slightly outside the radius of earthquake preparation zone. Behaviour of anomalies with distance from the epicentre was also being checked for getting an insight of the extent of the seismogenic effect on the ionospheric TEC.
Anomalies observed at KIT3 station was taken as a reference for determining anomalous day and exact anomaly time of the anomalous day was computed as described in above section (TEC anomaly and anomaly time detection). Keeping time fixed, the magnitude of anomaly was computed for all other stations. It was observed that with increasing distance, the magnitude of TEC anomaly decreases in all the cases which is completely analogous to the fact that the maximum anomalous values was observed near to the earthquake epicentre (figure 5). The magnitude of anomaly on the day of earthquake showed rather a complex behaviour. TASH shows the maximum anomaly at 5.983 UTC followed by POL2 and KIT3. However the overall trend increases towards the epicentre.
Conclusion
The study has revealed that Total Electron Content may be used as one of the parameter for seismic precursor. The analysis also suggest the degree and distance up to which ionospheric TEC can be exasperated because of the impending earthquake. The TEC anomaly (1 to 3 TEC units) can be considered as antecedents to gentle seismic tremors, while higher TEC varieties may encountered before larger magnitude earthquakes. These unpretentious changes are effectively recorded by close-by GNSS receivers and can be considered for testing, assessment, and general portrayal of seismo-tectonics and ionospheric coupling.
Behaviour of anomalies with distance from epicentre was also analysed which showed a downward trend indicating that the GNNS stations are not able to detect anomalies efficiently as we move away from the earthquake epicentre which suggests possibilities of epicentre detection with large GNSS stations. Hence, it is vital to screen constantly TEC utilizing GNSS receivers, and, at whatever point there is peculiar anomalies, which could be high or low. However, the challenge lies in data accessibility from ground stations (CORS/GNSS) and their analysis in real time on a daily basis which is the way forward and urgent need for earthquake precursor research
Acknowledgement
Authors thank Dr. Gopi Seemala, Indian Institute of Geomagnetism for proving the latest version of GPSTEC software for TEC computation. Authors also thank International GNSS Services (IGS) and World Data Centre for Geomagnetism and Space magnetism (WDC)) for freely providing high quality GPS and atmospheric data for the analysis.
References
Arikan, F., Nayir, H., Sezen, U., et al., 2008. Estimation of single station interfrequency receiver bias using GPS-TEC. Radio Science, 43(4)
Calais, E. ,Minster, J. B., 1998. GPS, earthquakes, the ionosphere, and the Space Shuttle. Physics of the Earth and Planetary Interiors, 105(3-4): 167-181
Davies, K., 1990. Ionospheric Radio. Peter Peregrinus, London. NOAA Space Environment Center Propagation Primer-AE4RV
Dogan, U., Ergintav, S., Skone, S., et al., 2011. Monitoring of the ionosphere TEC variations during the 17th August 1999 Izmit earthquake using GPS data. Earth, planets and space, 63(12): 1183-1192
Freund, F., 2011. Pre-earthquake signals: Underlying physical processes. Journal of Asian Earth Sciences, 41(4-5): 383-400
Freund, F. T., Kulahci, I. G., Cyr, G., et al., 2009. Air ionization at rock surfaces and pre-earthquake signals. Journal of Atmospheric and Solar-Terrestrial Physics, 71(17-18): 1824-1834
Garner, T., Gaussiran Ii, T., Tolman, B., et al., 2008. Total electron content measurements in ionospheric physics. Advances in Space Research, 42(4): 720-726
Grant, R. A., Raulin, J. P. ,Freund, F. T., 2015. Changes in animal activity prior to a major (M= 7) earthquake in the Peruvian Andes. Physics and Chemistry of the Earth, Parts A/B/C, 85: 69-77
Hegai, V., Kim, V. ,Liu, J., 2006. The ionospheric effect of atmospheric gravity waves excited prior to strong earthquake. Advances in Space Research, 37(4): 653-659
Kersley, L., Malan, D., Pryse, S. E., et al., 2004. Total electron content-A key parameterin propagation: measurement and usein ionospheric imaging. Annals of Geophysics, 47(2-3 Sup.)
Kumar, S. ,Singh, A., 2012. Effect of solar flares on ionospheric TEC at Varanasi, near EIA crest, during solar minimum period. 94.20. dt; 96.60. qe Liu, J., Chen, Y., Chuo, Y., et al., 2001. Variations of ionospheric total electron content during the Chi-Chi earthquake. Geophysical Research Letters, 28(7): 1383-1386
Liu, J., Chuo, Y., Pulinets, S., et al., 2002. A study on the TEC perturbations prior to the Rei-Li, Chi-Chi and Chia-Yi earthquakes. Seismo-Electromagnetics: Lithosphere- Atmosphere-Ionosphere Coupling: 297-301
Liu, J., Le, H., Chen, Y., et al., 2011. Observations and simulations of seismoionospheric GPS total electron content anomalies before the 12 January 2010 M7 Haiti earthquake. Journal of Geophysical Research: Space Physics, 116(A4)
Liu, J. Y., Chuo, Y., Shan, S., et al., 2004. Pre-earthquake ionospheric anomalies registered by continuous GPS TEC measurements. Annales Geophysicae, 22(5): 1585-1593
Ma, G. ,Maruyama, T., 2003. Derivation of TEC and estimation of instrumental biases from GEONET in Japan. Annales Geophysicae, 21(10): 2083-2093
Olwendo, O., Yamazaki, Y., Cilliers, P., et al., 2016. A study on the variability of ionospheric total electron content over the East African low-latitude region and storm time ionospheric variations. Radio Science, 51(9): 1503-1518
Ouzounov, D., Pulinets, S., Romanov, A., et al., 2011. Atmosphere-ionosphere response to the M9 Tohoku earthquake revealed by multi-instrument space-borne and ground observations: Preliminary results. Earthquake Science, 24(6): 557-564
Pulinets, S., 2004. Ionospheric precursors of earthquakes; recent advances in theory and practical applications. Terrestrial Atmospheric and Oceanic Sciences, 15(3): 413-436
Pulinets, S., Contreras, A. L., Bisiacchi- Giraldi, G., et al., 2005. Total electron content variations in the ionosphere before the Colima, Mexico, earthquake of 21 January 2003. Geofisica Internacional, 44(4): 369-377
Pulinets, S., 2009. Physical mechanism of the vertical electric field generation over active tectonic faults. Advances in Space Research, 44(6): 767-773
Sardon, E., Rius, A. ,Zarraoa, N., 1994. Estimation of the transmitter and receiver differential biases and the ionospheric total electron content from Global Positioning System observations. Radio science, 29(3): 577-586
Sardón, E. ,Zarraoa, N., 1997. Estimation of total electron content using GPS data: How stable are the differential satellite and receiver instrumental biases? Radio science, 32(5): 1899-1910
Seemala, G. ,Valladares, C., 2011. Statistics of total electron content depletions observed over the South American continent for the year 2008. Radio Science, 46(5)
Shah, M. ,Jin, S., 2015. Statistical characteristics of seismo-ionospheric GPS TEC disturbances prior to global Mw≥ 5.0 earthquakes (1998–2014). Journal of Geodynamics, 92: 42-49
Sharma, G., Champatiray, P. K., Mohanty, S. ,Kannaujiya, S., 2017. Ionospheric TEC modelling for earthquakes precursors from GNSS data. Quaternary International, 462: 65-74
Sharma, G., Champatiray, P. K., Mohanty, S. P., et al., 2017. Global navigation satellite system detection of preseismic ionospheric total electron content anomalies for strong magnitude (Mw> 6) Himalayan earthquakes. Journal of Applied Remote Sensing, 11(4): 046018
Valladares, C., Villalobos, J., Hei, M., et al., 2009. Simultaneous observation of traveling ionospheric disturbances in the Northern and Southern Hemispheres. Ann. Geophys, 27: 1501-1508
Yao, Y., Chen, P., Zhang, S., et al., 2012. Analysis of pre-earthquake ionospheric anomalies before the global M= 7.0+ earthquakes in 2010. Natural Hazards and Earth System Sciences, 12(3): 575


 (3 votes, average: 4.33 out of 5)


Leave your response!