| Perspective | |
Humorous science: Workplace office mysteries
This paper highlights humorous research related to typical problems encountered in the workplace office environment, which are investigated using spatial tools, physics and artificial intelligence |
 |
|
This is the second in a series of papers celebrating some of the weird and wonderful research findings hidden amongst the scientific literature. It aims to ensure that we remember the funnier side of science and provides answers to questions we may have been too afraid to ask. This study was conducted entirely in the author’s spare time and is in no way related to his employer. Here, we review selected research related to typical problems encountered in the workplace office environment, delving into the mysteries surrounding missing cutlery, spilled coffee, tumbling toast and happy chocolate.
Missing cutlery
The nocturnal activity patterns of an endangered population of the common fork (Furca domesticus) were investigated by Henckel (2005) from the School of Cutlery at the Institute of Inanimate Objects and Existential Phenomenology in Sydney (good luck tracking this author down). This fork-stabbing study was most likely inspired by the dynamic behaviour of cutlery in a typical office environment. The paper’s publication details are fictitious, and unfortunately it does not appear to be available online, so some extra detail is presented here.
To provide some background, the family Cutleridae is one of the more widespread domestic utensil families of the world. Semi-fossilised remains uncovered in France possibly represent a single megacutlery ancestor prior to the rapid speciation of the family associated with the evolution and expansion of hominoid fine dining. The nearest existing relative of this ancestor is believed to be the chopstick (Dicambium asiaticus) of north and east Asia. The ongoing global decline of the species is attributed to factors such as the advent of small-portioned finger food, the exponential growth of rapidly prepared, nutrition-poor and energy-rich hands-only cuisine, the current trend of eating being considered out of fashion by those in contemporary society who can most afford the economic cost of food, and collisions of forks in the wild with motor vehicles.
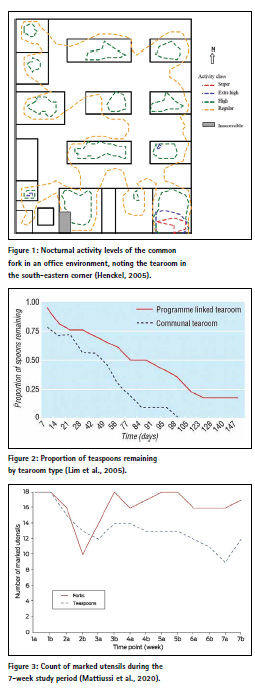
Through an extensive survey program, the study examined nocturnal fork activity and provided management recommendations to assist with the conservation and long-term viability of the population. Spotlighting was used as the basis for a targeted trapping program of individual forks. Captured forks were barcoded and fitted with a radio-collar that also included a movement sensor and mortality switch. Nocturnal fork movements were then plotted and mean nocturnal activity data was used to calculate minimum convex polygons. These were visualised spatially, and a modified temporal Jacobian crosslegged twirl non-parametric analysis was performed to create four activity classes (regular, high, extra high and super). A non-linear Mulder and Scully Prime Time analysis was then conducted to determine common fork microhabitat preferences.
The results indicated that the fork population utilised approximately 0.1 ha of habitat, including an area of extreme activity representing core habitat around the communal tearoom (Figure 1). Monitoring of individual forks revealed that the mean travel distance plateaued at 5 days, after which no extension of travel distance was observed. It was noted that some of the identified habitat may have displayed a higher than expected fork activity level due to the action of individual humans not returning forks to the tearoom when finished. This could have resulted in a type II error, identifying certain areas to be of greater use to forks than they actually are.
Henckel (2005) showed that the common fork is heavily reliant on humans for mobility and explained the diversity of the fork community by exploiter-mediated coexistence, whereby human presence promotes the coexistence of each cutlery species. In the absence of humans, the fork population would probably be unable to exploit the broad range of habitats they currently do, and an element of competitive exclusion in the folk community would cause a decline in diversity.
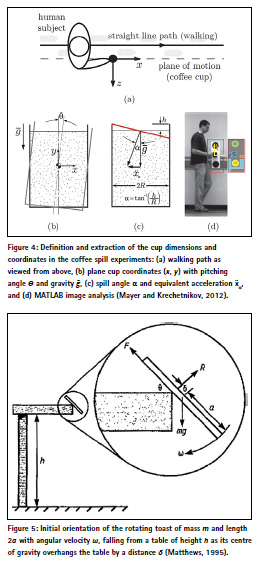
Lim et al. (2005) determined the overall rate of loss of workplace teaspoons in an Australian research institute and investigated whether attrition and displacement were correlated with the relative value of the teaspoons or type of tearoom. After distributing 70 individually numbered teaspoons throughout eight tearooms, weekly counts were carried out for 2 months, then fortnightly for another 3 months. Desktops and other immediately visible surfaces were also scanned for errant spoons. After 5 months, this previously covert research project was revealed to the institute’s staff, who were asked to return or anonymously report any marked teaspoons that had made their way into desk drawers or homes. Staff were also asked to complete an anonymous questionnaire about their attitude towards and knowledge of teaspoons and teaspoon theft.
It was found that 80% of the teaspoons disappeared during the study period. The loss was rapid and not influenced by their value, showing that teaspoon availability (and hence office culture in general) is constantly threatened. The teaspoon half-life was determined to be 81 days, i.e. half had permanently disappeared after this time. However, the amount of time a teaspoon survived in its final room varied significantly according to tearoom type: half-life of 42 days for communal tearooms and 77 days for rooms associated with particular research groups (Figure 2). Assuming that the annual rate of teaspoon loss per employee can be applied to the entire workforce of the city, it was estimated that 18 million teaspoons go missing in Melbourne each year. Laid end to end, these would extend over 2,700 km (the length of the entire coastline of Mozambique) and weigh over 360 metric tons (the approximate weight of four adult blue whales).
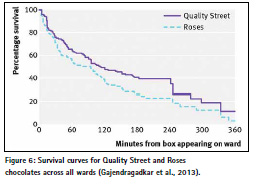
More recently, Mattiussi et al. (2020) evaluated the circulation lifespan of forks and teaspoons in a multi-disciplinary tearoom at a Brisbane hospital. They marked stainlesssteel forks and teaspoons (18 each) with red spots and introduced them alongside existing cutlery (81 items). For 7 weeks, the marked forks and teaspoons were counted twice weekly, along with careful searching of the dishwasher and all potential concealed locations in the tearoom.
It was discovered that significantly more marked teaspoons (6) were lost than forks (1). In stark contrast, unmarked cutlery showed increases for both teaspoons (5) and forks (2). This led the authors to contemplate whether introducing new utensils had an attractive effect on unmarked utensils, or whether it would have been better to conduct the study during Easter, when resurrection is a recognised and documented phenomenon.
The time series for the marked utensils revealed that the count of marked forks had dropped substantially at the second week 2 time point, but rapidly recovered during week 3. This pattern also applied, albeit less clearly, to the marked teaspoons (Figure 3). These utensils may have been victims of kleptomania, individual expropriation or used for a morning or afternoon tea celebration and not returned until thoroughly cleaned by an obsessive staff member.
In regard to where the missing cutlery could have gone, Lim et al. (2005) speculated that teaspoons may be escaping through space to a world inhabited entirely by spoon life-forms, although workplace kleptomania and laziness may provide a more likely answer.
Spilled coffee
Other studies focused on drinks and food routinely consumed in the workplace. Mayer and Krechetnikov (2012) investigated the annoying habit of coffee spilling out of its cup while the coffee drinker is walking, which is obviously a work health and safety concern. Using experimental physics, they studied the conditions under which coffee spills for various walking speeds and initial liquid levels in the cup (Figure 4). The motion was examined using an image analysis program written in MATLAB, while the instant of a spill was determined with a light-emitting diode (LED) signal triggered by a sensor monitoring the coffee level in the cup. It was shown that the particularities of the common coffee cup sizes, the coffee properties and the biomechanics of walking are responsible for the spilling phenomenon.
Examining methods to reduce such spillage, Han (2016) suggested walking backwards (acknowledging associated work health and safety issues) or using the ‘claw-hand’ method of carrying the coffee cup (around the rim) to suppress the higher-frequency components of the driving force and thus stabilise liquid oscillation.
Tumbling toast
Moving on to food, Matthews (1995) studied the dynamics of toast tumbling from a table to the floor. Popular opinion is that the final state is usually butter-side down, following Murphy’s Law (if it can go wrong, it will). The contrasting view is that the phenomenon is essentially random, with a 50/50 split of possible outcomes. Using theoretical and experimental evidence (Figure 5), he showed that toast does indeed have an inherent tendency to land butter-side down for a wide range of conditions, due to insufficient angular rotation (or spin) during the fall. In other words, the material properties of slices of toast and their size relative to the height of the typical table are such that, in the absence of any rebound phenomena, they lead to a distinct bias towards a butterside down landing. However, this can be counteracted by increasing the horizontal velocity applied to the toast when sliding off a tilted plate or leaving the table after being struck by a hand or arm.
Bacon et al. (2001) revisited the tumbling toast problem, taking advantage of video analysis software to aid the experimental investigation and sophisticated modelling programs to facilitate the numerical solution of non-linear differential equations. A plywood board of roughly the same dimensions as a piece of toast was used because the unevenness of the toast surface, its crumbly nature, variations from slice to slice, and its tendency to become hard and brittle over time affected the reproducibility of the experiments. They measured the coefficients of kinetic and static friction for the board and presented calculations of the expected angular velocity of free fall using a theoretical framework that included slipping (when the toast begins to slide off the table’s edge). The theoretical free-fall angular velocities were compared to previous calculations and experimental results obtained from video recordings of the tumbling board. This determined that slipping plays an essential role in the dynamics of tumbling toast and must be considered to get agreement with measured angular velocities. Finally, the total angle of rotation (during free fall from a table) was computed for various overhangs and the results compared with observations to confirm the tendency of butter-side down landings, albeit at a lower percentage.
In another food-related study, Stevance (2021) used artificial intelligence to prove that Jaffa Cakes are indeed cakes and not biscuits, despite their small size and host environment (the biscuit aisle). She trained two artificially intelligent binary classifiers generally used in the field of astronomy (a Random Forest and a Support-Vector Machine) on 92 recipes of traditional cakes and biscuits. Each recipe was normalised by total weight and classified by the Wet-To-dry Fraction (WTF index) to indicate how moist (or wet) the mixture is, providing a very informative distinguishing feature between cakes and biscuits. Two Jaffa Cake recipes were then fed to the algorithms, determining that these are, without a doubt, cakes. This result is further supported by the physical properties of Jaffa Cake, which hardens rather than softens when becoming stale.
Happy chocolate (consumption)
Chocolate is another essential commodity in the office environment. Chan (2007) reported on the Chocolate Happiness Undergoing More Pleasantness (CHUMP) study, which was designed to investigate the effects of chocolate consumption on happiness at a tertiary healthcare centre over a 1-month period. The 180 participants were randomised into three study groups. Group 1 received one 50 g dark chocolate bar each day, and group 2 received one 50 g milk chocolate bar each day. Group 3 did not receive any additional chocolate but continued with their normal chocolateeating habits. Each participant rated their happiness before and after the study using a visual scale (0 = unhappy, 10 = happy), along with their health, global happiness and personal work history.
Data collection proved to be difficult, demonstrating the challenges associated with performing a truly blinded trial. Despite all efforts to the contrary, several participants changed groups mid-study. Some participants in the control group (who received no extra chocolate) started raiding the chocolate of those in the other two groups, while others in the dark and milk chocolate groups traded chocolate based on their individual preferences. The milk chocolate group was the most popular, with the number of participants increasing from 60 at inception to 82 at completion. Furthermore, the occurrence of Halloween may have resulted in crossover contamination as some participants increased their chocolate intake after Halloween by eating extra chocolate that was intended to be distributed to children or by raiding their children’s loot bags. Not surprisingly, under these conditions, data analysis failed to prove the strong belief that chocolate consumption leads to more happiness. A far more important indicator of happiness in the CHUMP study appeared to be getting what you want when you want it.
Gajendragadkar et al. (2013) quantified chocolate consumption in a hospital environment by determining its median survival time. Two 350 g boxes of Quality Street and Roses chocolates were covertly placed on four wards at three hospitals in the UK, i.e. the study used a total of 8 boxes containing 258 individual chocolates. These boxes were kept under continuous covert surveillance, with the time recorded when each chocolate was eaten. On average, it took 12 minutes for a box to be opened after appearing. Chocolate survival was relatively low (median survival time of 51 minutes) and modelled well by an exponential decay model (initial rapid consumption rate that slowed over time), with a survival half-life (time taken for 50% of chocolates to be eaten) of 99 minutes (Figure 6). Chocolates were consumed primarily by healthcare assistants and nurses (28% each), followed by doctors (15%), and Roses chocolates were preferred to Quality Street chocolates. There was a trend that healthcare assistants and nurses preferred Roses chocolates, whereas doctors preferred Quality Street chocolates. However, examination by staff role showed preference for one type of chocolate to be statistically insignificant.
Conclusion
The selected studies have analysed some of the shenanigans occurring in the office environment and answered some intriguing questions related to the workplace. It is hoped that highlighting these issues will contribute to increased happiness and harmony. Substituting your next birthday cake for a new bunch of forks or teaspoons may go a long way towards achieving this goal.
Finally, for those dreading to attend the next work-related party, Armstrong (2020) presented a solution on how to maximise your positive impact on the social gathering and then escape discreetly as soon as possible. The procedure, dubbed Gradual Freeze-Out of an Optimal Estimation via Optimisation of Parameter Quantification (GFOOEOPQ), employs artificial intelligence and is based on Bayes’ Theorem where the probability of a future model state depends on current knowledge of the model. First, the user completes the necessary interactions for making favourable impressions, or at least ensuring that these people later remember seeing them at the event, and identifies possible exits (including the density of people at these locations and the general flow rate between regions). Once enough data is collected, GFOOEOPQ (pronounced g˄fui:ᴐ:p˄kw) identifies the exit that minimises the chance that anyone notices how early the user sneaked out. To achieve this, GFOOEOPQ employs a tempering procedure that iteratively arrives at the global optimum of a dynamic model, which remains valid only for a limited time due to the dynamic nature of the situation (i.e. “glance at the solution, glance over your shoulder, and then go for it or abort”). Tips for optimal interactions were also given, noting that the procedure can be generalised to corporate events and family gatherings if required.
References
Armstrong E. (2020) An artificiallyintelligent means to escape discreetly from the departmental holiday party: Guide for the socially awkward, https://arxiv.org/abs/2003.14169 (accessed Aug 2021).
Bacon M.E., Heald G. and James M. (2001) A closer look at tumbling toast, American Journal of Physics, 69(1), 38-43.
Chan K. (2007) A clinical trial gone awry: The Chocolate Happiness Undergoing More Pleasantness (CHUMP) study, CMAJ, 177(12), 1539-1541.
Gajendragadkar P.R., Moualed D.J., Nicolson P.L.R., Adjei F.D., Cakebread H.E., Duehmke R.M. and Martin C.A. (2013) The survival time of chocolates on hospital wards: Covert observational study, BMJ, 347(f7198), 7pp.
Han J. (2016) A study on the coffee spilling phenomena in the low impulse regime, Achievements in the Life Sciences, 10(1), 87-101.
Henckel J.A. (2005) Nocturnal activity patterns of an endangered population of the common fork (Furca domesticus), Applied Cutlery Conservation, 7(4), 235-241.
Lim M.S.C., Hellard M.E. and Aitken C.K. (2005) The case of the disappearing teaspoons: Longitudinal cohort study of the displacement of teaspoons in an Australian research institute, BMJ, 331(7531), 1498-1500.
Matthews R.A.J. (1995) Tumbling toast, Murphy’s law and the fundamental constants, European Journal of Physics, 16(4), 172-176.
Mattiussi M., Livermore A., Levido A., Starr T., Lassig-Smith M., Stuart J., Fourie C. and Dulhunty J. (2020) What the forks? A longitudinal quality improvement study tracking cutlery numbers in a public teaching and research hospital staff tearoom, Medical Journal of Australia, 213(11), 521-523.
Mayer H.C. and Krechetnikov R. (2012) Walking with coffee: Why does it spill? Physical Review, 85(4), 046117.
Stevance H.F. (2021) Using artificial intelligence to shed light on the star of biscuits: The Jaffa Cake, https://arxiv.org/ abs/2103.16575 (accessed Aug 2021).


 (1 votes, average: 1.00 out of 5)


Leave your response!