| GIS | |
GIS mapping to determine river pollution
The study focuses on the incorporation of GIS mapping to indicate the status of pollution in the sketch of River Ravi downstream to the wastewater outfalls in Pakistan |
 |
|
 |
|
 |
|
Water is essential for all forms of life and ecosystems. Rivers are essential as they serve humans with ample fresh water supply. Although rivers contain only 0.0001% of the total global water, they are key carriers of nutrients and water worldwide (Wetzel, 2001). The evolution of human civilization is associated with rivers and its adjoining fertile flood plains. However, a dynamic shift in human civilizations resulted in variation of water use patterns along with unavoidable discharge of sewage and solid wastes into water bodies (Song & Kim, 2006). The condition of river pollution in third world countries worsens day-by -day, where the rivers are considered easy disposal points for effluents. Similar is the case of River Ravi, which is significantly polluted due to excessive discharge of untreated sewage and waste water released from Lahore and its associated industrial estates (Ahmed & Ali, 1998) through five wastewater drain outfalls and a surface drain (WWF, 2007). This discharge is estimated to be 40 m3/s, which would be increased approximately to 56 m3/s by 2025 (Haider, 2010). Besides this, another major cause of pollution of River Ravi is the Indus Water Treaty of 1960, signed between India and Pakistan that governs the trans-boundary water rights of the two countries leading to extreme flow variation in the river which ranges between 10 and 10,000 m3/s (IPD 1967-2004).
The discharge of untreated effluent into the environment may have severe adverse impact on the quality of the receiving water body (Eluozo, 2012). Therefore, river water quality management is essential to meet the water quality expectations for streams and rivers to ensure protection of the drinking water resources, provision of healthy environment for aquatic ecosystem and encourage recreational activities (Amadi et al., 2010). The proper monitoring of water quality is an essential component of river water quality management. However, the selection of parameters for water quality assessment and monitoring of the pollution of rivers depends on the objectives of the monitoring (Bartram & Balance, 1996). The parameters of special concern for waste water pollution estimation are temperature, pH, TSS, TDS, COD, BOD5, Chloride, Sulfate, Sulfide, and heavy metals.
In recent years, the Geographic Information System (GIS) is considered as an effective tool in wastewater management as it enables the large volume of data handling much easier (Gemitzi et al., 2007; Huffmeyer et al., 2009). Its application leads to more effective decision-making (Hughes, 2006). The objectives of the study involves determination of the concentration of 19 pollutants at six wastewater outfalls of Lahore, integrate GIS mapping to identify the potential pollution loading sites, and geographically indicating pollution in various portions of the river, downstream to the wastewater outfall points.
Materials and Methods
Study Area
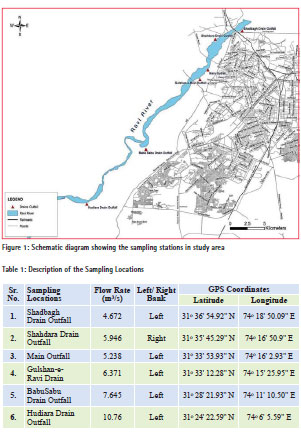
River Ravi is a trans-boundary river, part of the Indus Basin System that originates in India and enters Pakistan where it passes through Lahore, Pakistan’s second largest city. It receives untreated municipal and industrial wastewater through five municipal drains outfalls of the city and one surface water drain (Figure 1).
Sampling Sites
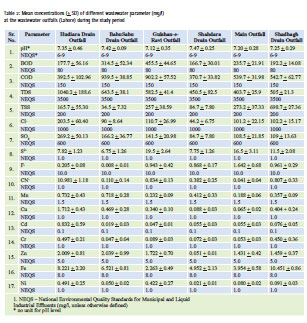
The sampling for the purpose of this research was carried out at six sampling stations located at each wastewater outfall point in Lahore (Table 1).
Sample Collection, Preservation and Chemical Analyses
Time proportional composite sampling of the wastewater was carried out four times during the study period with the interval of two months between October 2012 and April 2013 at all the six sampling locations. The sample collection was done at the point of turbulent flow near the outfall points of the drains and all the sampling was performed during day time, between 10 am to 4 pm, using simple manual sampling apparatus such as a bucket and rope. The collected wastewater samples were then transferred to prepared sampling bottles, i.e., pre-rinsed with 10% nitric acid or only washed with detergents, depending on the parameters of interest. Furthermore at the time of sampling, the detail sample descriptive information and GPS coordinates using GARMIN eTrex 20 were recorded along with each sample. The collected samples were then transferred and preserved in a certified environmental laboratory for analysis, and the analyses of the samples were performed in accordance to ‘Standard Methods for the Examination of Water and Wastewater’, 21st Edition by American Public Health Association, 2005 (APHA, 2005).
GIS Mapping
GIS mapping of the different pollutants at the wastewater outfalls, assessment of the pollutant loads discharged into River Ravi from six wastewater outfalls of Lahore and relative contamination of different portions of River Ravi downstream to each outfall point was done using ArcGIS 9.0.
Flow Rate Data
The flow rate data in the drains (Table 1) required to calculate the unit pollutant load were obtained from JICA, 2010 – “The preparatory study on Lahore water supply, sewerage and drainage improvement project in Pakistan”, JICA report WASA Lahore report no. 24, pp. 5-48.
Results and Discussion
Physicochemical Characteristics of the Wastewater
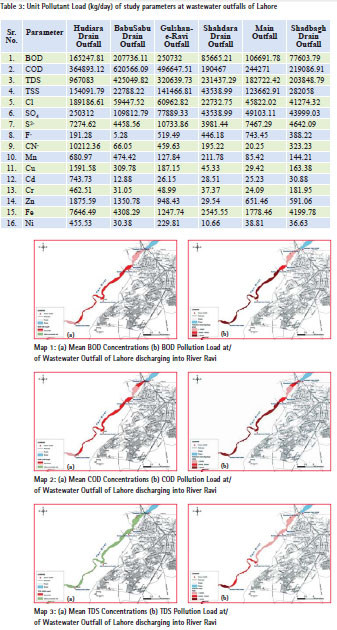
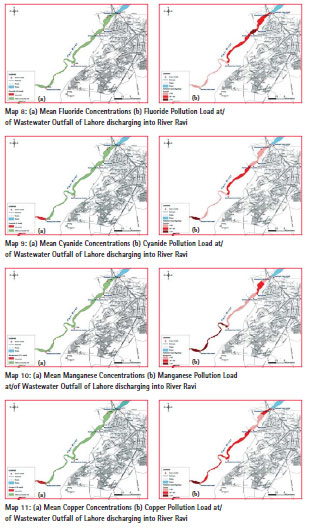
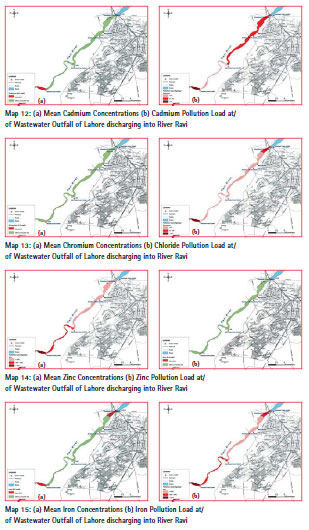
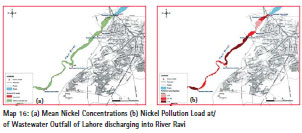
Results of the wastewater analyses for the samples collected from the six wastewater outfalls of Lahore (Table 2) revealed that the total dissolved solids (TDS), sulfate (SO4), chloride (Cl-), fluoride (F-), manganese (Mn), chromium (Cr), zinc (Zn), and nickel (Ni) were found within the permissible limits of the Pakistan’s National Environmental Quality Standards (NEQS) at all the six wastewater outfalls. However, the biochemical oxygen demand (BOD5), chemical oxygen demand (COD), and sulfide (S2-) throughout the study period, at all six wastewater outfalls of Lahore, were exceeding the NEQS permissible limits. Moreover, the total suspended solids (TSS) in Shadbagh Drain Outfall, Main Outfall and Gulshan-e-Ravi Outfall, and copper (Cu), cyanide (CN), and cadmium (Cd) in Hudiara Drain Outfall exceeded the set limits. Furthermore, the GIS mapping (Map 1 (a) – 16 (a)) of the mean pollutant concentrations indicating the portions of River Ravi most affected by the untreated wastewater discharges of these pollutants from the six wastewater outfalls of Lahore could be expedient in effective decisionmaking to control the wastewater pollution of the river on exact area of requirement.
Organic Loading
The high organic loading (BOD5 and COD) of River Ravi from the wastewater outfalls of Lahore is mainly due to lack of a single primary or secondary municipal wastewater treatment plant located at any of the wastewater drains in Lahore. The conventional primary wastewater treatment facility and secondary wastewater treatment facility can reduce the BOD level up to 35% and 85%, respectively (Stoddard et al., 2002). Moreover, as the water flow in river upstream to Balloki Headwork is very low in most parts of the year (Shakir&Qazi, 2013), with addition of such high oxygen demanding wastewater, the dissolved oxygen availability may lessen to the level which would be fatal to most aquatic species. The GIS maps (Map 1(a) and Map 2(a)) have indicated that the portions of the river downstream to the point of confluence of Main Outfall, Gulshane- Ravi Outfall, BabuSabu Outfall and Shadbagh Drain Outfall, are most affected by the organic loading from Lahore.
Total Solids
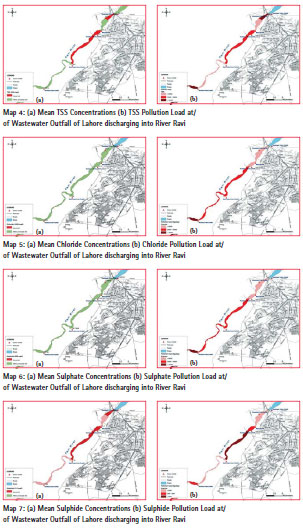
Total solids include total suspended solids (TSS) and total dissolved solids (TDS) present in the wastewater (APHA, 2005). Map 4(a) indicates that high suspended solid content in wastewater effluents of Shadbagh Drain Outfall, Main Outfall, and Gulshan-e-Ravi Outfall are affecting the stretch of the river, downstream to their confluence points. The high TSS contents may bind toxins with them that are toxic to the fish and other aquatic ecosystem. The research literature reveals that high level of TSS introduced to the riverine water increases the turbidity of the water, and thus affects the spawning, growth and reproduction of the fish species (Bonis??awska et al., 2011).
Moreover, Map 3(a) has highlighted that the TDS contents in the wastewater of Lahore discharging into the river is between 276 mg/l and 1300 mg/l, i.e., within the NEQS limit.
Sulfates/ Sulfides
The sulfate concentrations in all the wastewater outfalls of Lahore were well within the NEQS limit (Map 6(a)). However, the sulfide concentrations (Map 7(a)) in all the wastewater samples of the outfalls were found exceeding the 1.0mg/l permissible limit of the NEQS, thereby polluting River Ravi significantly. These high sulfide concentrations in Lahore’s wastewater were possibly due to the industrial discharges into the municipal wastewater collection system. The sulfide present in the wastewater may react with hydrogen to produce hydrogen sulfide, a highly toxic, odorous and corrosive gas (Muyzer&Stams, 2008). Even at low concentrations, hydrogen sulfide gas has a foul odor and possesses significant threat to human health in the exposed communities (Sutherland-Stacey et al., 2008). Therefore it would make the river water unfit for recreational activities. Moreover, the communities developed on the banks of the river, i.e., Kachi Abadis would be exposed to health hazards arising from the hydrogen sulfide presence in the environment.
Halides (Chloride and Fluoride)
Halides, including the chlorides and fluorides presence in the wastewater outfalls were within the permissible limit (Map 5(a) and Map 8 (a) respectively). However, the fluorides in the riverine ecosystem even at low concentrations would tend to accumulate in bone tissues of the fishes and exoskeleton of invertebrates (Camargo, 2003). Moreover, the major impacts associated with the presence of chloride in the wastewater discharging into River Ravi are degradation of aquatic biota and terrestrial flora irrigated with chloride contaminated surface water. The high chloride concentration accumulated in soil, chronically irrigated with chloride contaminated water would decrease the rate of microbial degradation (Gryndler et al., 2007).
Metals
Among the metals in the wastewater drains discharging into River Ravi, the Hudiara Drain Outfall samples have shown the highest relative mean concentration for all metals, except for zinc whose maximum mean concentration was determined in Babu Sabu Drain Outfall, and iron whose maximum mean concentration was at Shadbagh Drain Outfall during the study period (Map 9(a) – 16(a)). The mean concentrations of Cd, Fe, CN, and Cu in the Hudiara Drain Outfall exceeds the permissible limits, which is hypothetically due to collection of untreated industrial wastewater by the Hudiara Drain and its tributary drains that passes through the areas where majority of the industrial zones exist. There are 212 industries located in India and Pakistan that discharge their untreated industrial effluents into Hudiara Drain (Shakir&Qazi, 2013). Moreover, the Fe concentration at the Shadbagh Drain Outfall exceeded the permissible limit throughout the study period because the drain receives untreated industrial wastewater from steel foundries, scrap yards, and steel re-rolling mills located in the collection area of the drain.
The high concentration of metals in Hudiara Drain Outfall and Shadbagh Drain Outfall might exert high eco toxicological impacts on the aquatic ecosystem of the river, downstream to the points of confluence, i.e., outfall points. The metallic elements can disrupt the metabolic function in aquatic organisms by binding the enzymes essential elements, and also produce adverse effects on their growth and reproduction. Fish are recognized as good accumulator of metals, especially heavy metals; they accumulate the heavy metals in their fatty tissues and thus enter the food chain. Thereafter, these heavy metals undergo biomagnification as they travel through the food chain and are transferred in magnified concentrations to humans and other animals, and thus consuming the contaminated aquatic food poses a threat to public health (Miller et al., 2002). Over the years, eco-toxicity associated with heavy metal pollution has become a major health concern because the heavy metals in the form of colloidal, particulate and dissolved forms are persistent in surface water bodies (Miller et al., 2003).
Pollutant Load Assessment
The pollutant load assessment of the study (Map 1(b) to Map 16(b)) revealed that although few pollutants that were discharged into River Ravi were relatively low in concentrations at one wastewater outfall point as compared to others and in some cases, even within the permissible limits of NEQS, but they have a high pollutant load. For instance, the mean BOD concentration in Main Outfall was greater than that in the Hudiara Drain Outfall, but the BOD pollutant load of these two outfalls were inverse (Map 1). Similarly, the mean concentration of COD in Hudiara Drain Outfall was less than that in Main Outfall and Shadbagh Drain Outfall, but the COD pollutant load was greater in Hudiara Drain Outfall relative to these two outfalls (Map 2).
Similarly, the sulphide mean concentration in Hudiara Drain Outfall is lesser than the Main Outfall and Shadbagh Drain Outfall, but still it has a relatively higher sulphide pollution load (Map 7). Moreover, the chloride mean concentration in Main Outfall was greater than Babu Sabu Drain Outfall but in terms of chloride pollution load, the relationship was contrary (Map 5). Similar was in the case of iron’s pollutant load, for which mean the iron concentration in Shadbagh Drain Outfall was greater than that in Hudiara Drain Outfall. But in terms of iron pollution load, the Hudiara Drain Outfall with a mean concentration within the NEQS limit has the greatest pollutant load among all six wastewater outfalls of Lahore (Map 15).
Furthermore, the GIS mapping of the study revealed that even though the mean TSS concentration in Hudiara Drain Outfall (i.e., 165.7 mg/l) was within the NEQS limit of 200mg/l, while concentration in the Main Outfall (273.2 mg/l) and Gulshan-e-Ravi Outfall (257 mg/l) exceeded the NEQS limit. However, the TSS pollutant load of the Hudiara Drain Outfall is still greater than the wastewater mentioned in these two outfalls.
Therefore although in Pakistan, legislative requirements only demand the concentration of pollutants in the wastewater to be within the prescribed standards, no pollutant loads standards or procedures exist. But as revealed by comparison through GIS mapping, the not be the only parameter to determine the characteristics and quality of wastewater, because significant pollution might be ignored due to monitoring of only pollutant concentration. Thus, a specific legislation is needed to be set in Pakistan, especially for River Ravi because of its low dilution factor to avoid pollution shock in the river.
Conclusion
The present study has recognized the potential polluted spots of River Ravi and revealed that although the few pollutants discharged into the river were relatively low in concentration at one wastewater outfall point as compared to another, it may have a high pollutant load that may lead to significantly higher ecological impact. Thus, GIS application in environmental monitoring could be an effective tool in environmental decision-making to introduce optimum treatment engineering controls at points of interests to prevent the ecological damages and protect human health. Therefore, there is a critical need to incorporate GIS applications in environmental decision-making to assess the environmental impacts effectively.
References
1. Ahmad, K., & Ali, W. (1998). Variation in the River Ravi quality. Paper presented at 24th WEDC Conference, Sanitation and Water for All, Islamabad. 153-156. Retrieved from http://wedc.lboro.ac.uk/resources/ conference/24/Ahmedk.pdf
2. Amadi, A. N., &Olasehinde, P. I., Okosun, E. A., &Yisa, J. (2010). Assessment of the water quality index of Otamiri and Ora-miriukwa Rivers. Physics International, 1(2), 116 – 123.
3. American Public Health Association. (2005). Standard Methods for the Examination of Water and Wastewater (21st ed.). New York: American Public Health Association.
4. Bartram, J., & Balance, R. (1996). Water Quality Monitoring: A Practical Guide to the Design and Implementation of Freshwater Quality Studies and Monitoring Programmes. London, UK: UNEP/ WHO.
5. Camargo, J. A. (2003). Fluoride toxicity to aquatic organisms: A review. Chemosphere, 50(3), 251-264.
6. Eluozo, S. N. (2012). Modelling the transport of streptococci on hetrogeniouscaorse sand influenced by porosity and permeability in caostal area of degema. ARPN Journal of Earth Sciences, 1(2), 52-56.
7. Gemitzi, A., Tsihrintzisb, V. A., Christouc, O., &Petalasb, C. (2007). Use of GIS in sitting stabilization pond facilities for domestic wastewater treatment. Journal of Environmental Management, 82(2), 155–166.
8. Gryndler, M., Rohlenova, J., Kopecky, J., &Matucha, M. (2008). Chloride concentration affects soil microbial community. Chemosphere, 71(7), 1401-1408.
9. Haider, H. (2010). Water quality management model for Ravi River (Doctoral dissertation). University of Engineering & Technology, Lahore.
10. Huffmeyer, N., Klasmeier, J., &Matthies, M. (2009). Geo-referenced modeling of zinc concentrations in the Ruhr river basin (Germany) using the model GREAT-ER. Science of the Total Environment, 407(7), 2296-2305.
11. Hughes, J. R. (2006). GIS combines Geography and information for effective utility management. American Water Works Association Journal, 32(12), 10-11.
12. Irrigation & Power Department (IPD), Punjab. (1967-2004). Gauge and Discharge Data of River and Canals. Lahore, Punjab: Irrigation & Power Department, Punjab.
13. Miller, C. V., Foster, G. D., &Majedi, B. F. (2003). Baseflow and stormflow metal fluxes from two small agricultural catchments in the coastal plain of Chesapeake Bay Basin, United States. Applied Geochemistry, 18(4), 483-501.
14. Miller, G. G., Sweet, L. I., Adams, J. V., Omann, G. M., Passino- Reader, D. R., & Meter, P. G. (2002). In vitro toxicity and interactions of environmental contaminants (Arochlor 1254 and mercury) and immunomodulatory agents (lipopolysaccharides and cortisol) on thymocytes from lake trout (Salvelinusnamaycus). Fish and Shellfish Immunology, 13(1), 11-26.
15. Muyzer, G., &Stams, A. J. M. (2008). The ecology and biotechnology of sulphatereducing bacteria. Nature reviews. Microbiology, 6(6), 441-454.
16. Shakir, H. A., &Qazi, J. I. (2013). Impact of industrial and municipal discharges on growth coefficient and condition factor of major carps from Lahore stretch of River Ravi. The Journal of Animal & Plant Sciences, 23(1), 167-173.
17. Song, T., & Kim, K. (2009). Development of a water quality loading index based on water quality modeling. Journal of Environmental Management, 90(3), 1534-1543.
18. Wetzel, G. W. (2001). Limnology: Lake and River Ecosystems. New York: Academic Press. The paper was presented at 9th National GIS Symposiun in Saudi Arabia at Damman during April 28-30, 2014


 (4 votes, average: 2.50 out of 5)


Leave your response!