| Applications | |
GIS & GPS in micro-spatial location analysis of solid waste disposal sites
An analysis of dumper bins in different circles of Hyderabad Municipal Area shows that its distribution is highly uneven |
 |
|
 |
|
 |
|
Urban areas garbage is collected either by a government agency or private contractor. Garbage disposal constitutes a basic and expected service or function of urban local body. Urban solid waste management has become a major issue of concern for many underdeveloped nations, especially with population explosion. The problem is compounded as many nations continue to urbanize rapidly. The percentage of India’s population living in cities and urban areas has doubled. The garbage generated in the city has to be stored and collected at some common point from where it can be transported finally to the landfill sites or dumping yards. The primary collection and storage points are the dumper bins. They are large bins/containers which are placed at a location where large quantity of waste can be collected. These bins are directly transported by a dumper placer to Transfer Stations. The placement of bins to various locations depends upon the type of locality and amount of waste generated, access to road. etc.
Study area
The present study area is a part of Hyderabad Municipal Area Circle VI. It is the centrally located circle of Hyderabad city (Figure.1). It is the smallest of all circles, consisting of four wards. The area covered by this circle is less than six sq km. It is well served by road network. This circle includes the CBD of Hyderabad. Accordingly, the landuse of this circle is mixed in nature, i.e., it is characterized by commercial, institutional and residential landuse. Since it includes CBD and also due to its central location, this circle is well connected with other parts of the city. This circle is divided into four wards, i.e., 4A, 4B, 5A, 5B and 14 localities. Circle VI of Municipal Corporation of Hyderabad covers an area of 5.42 sq km. This circle recorded 38 slums and all these slums are notified slums. Circle VI registered 40,000 households and 6,000 commercial establishments.
Objectives
1. To locate dumper bins with GPS and its spatial analysis
2. To suggest optimal and new location of dumper bins using GIS
3. To generate inter distance dumper bin index
Methodology/Database
The study is based on secondary data which is supplemented by primary data. The secondary data is mostly collected from the Municipal Corporation of Hyderabad, Census of India. Road network is captured from survey of India Toposheets and other published sources. The primary data is collected based on questionnaire surveys. Sampling technique is used for the generation of primary data. Arc GIS software is used in processing, presentation and analysis of data. Buffering and network analysis is used in the location of dumper bins and routing purpose. GPS survey is done to locate dumper bins. Each dumper bin is given an ID No. The data is presented in the graphical and in the form of various types of thematic maps.
Distribution of dumper bins in Municipal Corporation of Hyderabad
For efficient Solid Waste Management, information about the number of bins and its distribution is vital. An analysis of dumper bins in different circles of MCH shows that its distribution is highly uneven. Maximum number of dumper bins are located in circle V (509) constituting about 22% of total number of bins in Municipal Corporation of Hyderabad (Table 1). Circle V of Municipal Corporation of Hyderabad is associated with high income households. This circle has more number of high-rise buildings with upcoming commercial establishments. Minimum number of bins (50 Nos) constituting only 2.2% of total number of bins in Municipal Corporation of Hyderabad is associated with circle II. This circle constitutes a part of Hyderabad south, which includes the old historical core of the city. Even though, most of the localities in this circle include densely populated areas, still the numbers of bins are few. This situation calls for immediate focus of urban local body to locate more number of bins and efficient system of garbage collection.

The spatial pattern of distribution of dumper bins in different circles of MCH is presented in Table 1. It is seen from Table 1 that the least number of dumper bins are located in circle II of Hyderabad. The reason for less number of bins in circle VI may be due to its small size. In case of circle II, it could be due to less densely built-up area and less number of bulk garbage generating units. Highest number of bins (>400) are associated with wards I, V and VII which could be due to its large areal extent. It is thus seen that the dumper bins in a particular ward, to a great extent, is influenced by its areal extent and quantum of garbage generated.
Circle VI – Spatial distribution of dumper bins
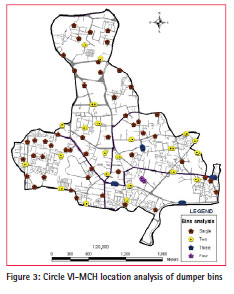
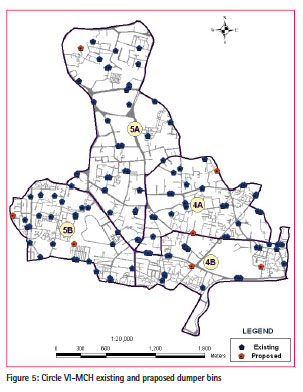
The dumper bin locations are captured using Global Positioning Survey (GPS). The latitude/ longitude positions are fed in to the system as a dbf file and a shape file is generated for the same. This way, the exact locations of the dumper bins are captured and they are depicted as point feature. Each dumper bin is assigned an ID number. The location analysis of dumper bins is clearly brought out that distribution of dumper bins to a great extent seems to be uniform in case of ward 5A, but it is not the case of ward 5B and 4B. The dumper bin location in ward 5B seems to be clustered in the western side of the ward boundary and along the southern boundary of the ward. The eastern side of ward 5B is ill served in terms of dumper bins location; where as the central part is not at all served by dumper bins locations. Similar is the observation in ward 4B where location of dumper bins are highly agglomerated in western and eastern margins of the ward boundary with a wide area which is devoid of any dumper bins. It is observed that the location of dumper is not properly distributed.

Ward wise analysis of dumper bins
There are 108 existing dumper bins in circle VI of Municipal Corporation of Hyderabad. The number of dumper bins in different wards of circle VI is not uniform. Maximum number of dumper bins is recorded in ward 5A. The reason for highest number of bins in this ward is due to the fact that the area covered by this ward is more. Wards 4A, 4B, 5B are more or less similar in extant of area, but still there is a marginal variation in the number of dumper bins located. Ward 4B has 26 existing dumper bins. Even though the area is not very large, still there are more dumper bins in this ward due to more number of households recorded by this ward. Besides, garbage generated in this ward is also high. Least number of dumper bins is located in ward 4A. The reason for less number of dumper bins is attributed to more number of institutes, hospitals and commercial establishments where garbage is lifted directly by the trucks.

Pin Point Programme (PPP)
Pin Point Programme defines the schedule of Solid Waste Management from the specified dumper bin locations on a daily basis and shift wise regularly. In this programme, each vehicle is tracked for route and waste collection in this route, and transfer it to the Transfer Station and finally the waste is shifted from there to the Jawahar Nagar dump yard. This programme ensures solid waste collection vehicle-wise and route–wise.
The distribution of dumper bins in circle VI of MCH revealed variations in term of its distribution. An analysis of dumper bins before and after Pin Point Programme is done here. This Programme aims toward efficient and sustainable Solid Waste Management. Keeping this in view, it is expected that the number of bins should increase after the implementation of Pin Point Programme for increasing capacity and efficiency of garbage storage and collection. Contrary to this expectation, it is seen that the number of dumper bins decrease from 121 to 108 after the implementation of Pin Point Programme. The purpose behind reducing the number of bins is to increase the collection efficiency and that can be achieved by efficient transportation, i.e., increasing number of tricycle. As seen from Table 2, it is observed that highest number of decrease in dumper bins is reported especially by Ward 4A (6 Nos). No removal of dumper bins is recorded by Ward 5A.
The efficiency of collecting garbage cans is assessed by computing the number of houses that are covered by each dumper bin. It is seen from Table 3 that the number of houses covered per bin is highest in Ward 4A (223 Nos) and least in 5B (172 Nos). The higher ratio of houses to bin is more in Ward 4A and 4B, which is due to the fact that these wards are densely populated areas.

Dumper bin location and transfer station
The garbage from door-to-door collection is dumped into the dumper bins which ultimately are transported to the Transfer Station (TS). The garbage from Circle VI is transported to two nearest Transfer Stations, i.e., Imlibun Transfer Station (ITS) in north and Tankbund Transfer Station (TTS) in south. The garbage from Circle VI is mostly transported to Imlibun Transfer Station, except the dumper bins located in the northern part of the study area (Figure) which is associated with Ward 5A. It includes localities like Hill Fort, Fathemaidan, Gunfoundry, Abids, Abids south. The reason for transferring garbage from dumper bins to the Tankbund Transfer Station is due to its proximal location. Garbage from only one dumper bin in Ward 4A is transferred to Tankbund Transfer Station (figure 2).

Inter bin distance analysis
An analysis of the distance between one dumper bin and another is very important in the collection and transportation of garbage. As seen from Table 4, there are 108 dumper bins in Circle VI. The distance matrix of these 108 dumper bins in different wards is shown in Table 4. The distance between one bin and another is as high as 469 mt (Ward 4A, bin ID 58) and as low as 60 mt (Ward 5A, bin ID 93).
As seen from Table 4, the distance between the nearest dumper bins vary from ward to ward. Out of 108 dumper bins, only 10 bins are located within a distance of <100 mt, constituting 9.25% only. Out of these 10 bins, 7 bins are located in Ward 4B and three in Ward 5A. On the other hand, there are 9 bins which are located at the distance >400 mt constituting 8.33% of the total number of the dumper bins. Maximum number of dumper bins is located within a range of 200-300 mt. Ward-wise analysis of inter distance between dumper bins shows that in Ward 4A, there are no bins located within a distance of <100 mt. Nearly half (45.83%) of the dumper bins in Ward 4A are located in inter bin distance range of 300-400 mt. In Ward 4B, inter bin distance shows that nearly ¼th of dumper bins are located at a distance range of <100 mt. It is due to the fact that the dumper bins are mostly agglomerated in the eastern periphery of the ward. In Ward 5A, most of the dumper bins are located within a range of 200-300 mt. The larger inter bin distance is due to the fact that the area covered by this ward is more.
Location analysis of dumper bins
As seen earlier, there are 108 dumper bins located in Circle VI. Generally one dumper bin is located at a place, but it is seen in the study area that in different locations, more than a single dumper bin is placed. It is seen that at places the number of bins are more than one. The number of bins at a place is determined based on the quantum of garbage generated, number of houses and houses holds, road conditions, etc.
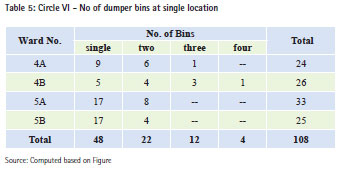
A cursory glance at Table 5 shows that out of 108 dumper bins in Circle VI, 48 bins are placed at a single location where as in 22 locations two bins are located at a single place. In four locations, three dumper bins are located side-byside, making a total of 12 bins. Only at one place were 4 dumper bins placed adjacent to each other. (Plate 1, 2, 3, 4)

The location of dumper bins as seen from Figure 3 reveals that the number of dumper bins in each location is not the same. In Ward 4A, nine locations are associated with single bins whereas in six places, there are two bins placed in a single location. There is only one place with three bins located at the margin of Sultan Bazar, Troop Bazar locality. There are no sites with four bins in Ward 4A. In Ward 4B, single bins are located in only 5 locations, whereas double bins are located in 4 locations and three bins are placed in three locations. The uniqueness of Ward 4B is that it is the only ward where 4 bins are located at a place that is in Jambagh locality. Two bins located at a single point in Ward 4B are associated with localities like Badchowdi, Jambagh, Esamiabazar which are densely populated areas. In Ward 5A, 17 locations are registered as single bins whereas 8 places are recorded as double bins. The circle being commercial and institutional in nature, nowhere in Ward 5A are three and four bins located in a place. At 17 places in Ward 5B, single bins are located whereas in four places, double bins are located. No place with three and four bins is seen in this ward.
Locality-wise analysis of dumper bins revealed that maximum number of single dumper bins is located in Aghapura locality of Ward 5B. The problem of garbage collection and storage in this locality is substantiated by the fact that it is one of the largest localities with more number of premises and units. Only in one place are two dumper bins placed at a single location. Gunfoundry locality in Ward 5A is the only locality with a distinction of not having more than one dumper bin located in a single point. Esamia Bazaar locality in Ward 4B is the only locality where three dumper bins are placed in a single location. Ward 5A and 5B are do not have localities with 3 or 4 bins at a single point.

Optimal location of proposed dumper bins
The distribution of dumper bins with a radius of 100 mt is shown in figure 4. The radius of 100 mt is considered here as an ideal distance from the point of view of collection of garbage. Buffering is used here as a decision support mechanism in the identification of gaps in the location of existing dumper bins. The location of dumper bins with a buffer of 100 mt radius revealed that there are gaps existing where new dumper bins can be located. It is observed from the figure that overlap in certain places. An attempt has been made to identify new locations based on the existing gaps.


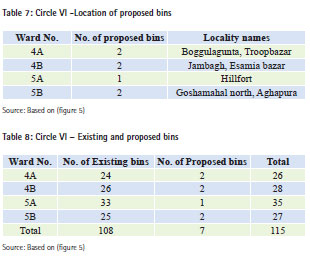
An analysis of existing dumper bins based on buffering technique revealed that there are certain gaps in the location of dumper bins (Figure 4). To identify new locations of dumper bins, buffers are drawn (100 mt) around dumper bins. Taking into consideration the transportation network, garbage generation, new location of dumper bins are proposed. Already there are 108 dumper bins in Circle VI. Seven more new dumper bin locations are identified. In Ward 4A, two new bins have been proposed, one at Boggulagunta and another at Troop Bazaar.
With two proposed dumper bins, the number of dumper bins in Ward 4A will be increased from 24 to 26. In Ward 4B also, two new places have been proposed for the location of dumper bins – one at Jambagh and another at Esamia Bazaar. The total number of dumper bins in Ward 4B will be increasing from 26 to 28. In Ward 5B, the proposed location of dumper bins are at Aghapura, Goshamahal north. With these two new proposed locations, the total number of bins will increase from 25 to 27 in Ward 5B (Figure 5). In Ward 5A, only one location has been identified in the Hillfort locality. Even though this ward is very big, the proposed location is only one due to the fact that, this ward has large number of bulk garbage generating units where the garbage is collected at the door step. Besides, the number of households is also less as compared to other wards.


Conclusion
It is observed that the location of the dumpers has not been properly distributed. Ward wise analysis revealed that the number of dumper bins to a great extent has been influenced by quantum of garbage generation and areal extent of the ward. The ratio of houses to bin is related to the density of population. The inter distance matrix of dumper bins revealed that there is a wide variation. The four bins at single location are related to density of population. Buffer analysis revealed the gaps and overlaps in the location of bins. Based on buffering technique new location of dumper bins is proposed on terms of inter bin distance.
References
• Shekdar. 1999 Municipal Solid Waste Management – the Indian perspective Journal of Indian Association for Environmental Management, 26 (2): 100–108.
• Mungai, G. 1998. “Solid Waste Management and its environmental impact in Kenya”. In: Solid Waste Management: critical issues for developing countries, edited by Elizabeth Thomas-Hope, 159-167. Kingston: Canoe Press, 1998.
• Integrated Urban Environment Improvement Project for the Bangalore City, Detail Project Report submitted to NORAD, March, 1998, Prepared by Bangalore Development Authority (BDA), Centre for Environment Education (CEE), Technology Informatics Design Endeavour (TIDE).
• De Man, W.H.E., 1988. Establishing a Geographical Information Systems in relation to its use: A process of strategic choice. International Journal of Geographical Information Systems, Vol. 2, No. 3, pp. 245-261.
• Scholten, H.J. and Padding, P., 1990. Working with Geographic Information System in policy environment. Environment and Planning B, Vol. 16, pp. 405-416.
• Gupta, R.D., P.K. Garg and M. Arora, 2001, A GIS Based Decision Support System for Developmental Planning in Dehradun District, Journal Indian Cartographer, Vol. 21.
• Roy, A.K., P.K. Champati Ray and R.C. Lakhera, 1992, A New Horizon of GIS Application and Integrated Approach in Geosciences, Proceedings of the Silver Jubilee Seminar, IIRS, Dehradun, India, pp. 34-40.
• Abdul Wahid Gazali and Aziz Muda, 1998, Solid Waste Management Planning in Local Authorities in Malaysia, A Need for an Integrated Planning, Fakulti Sains dan Pengajian Alam Sekitar, Universiti Putra Malaysia.
• Agamuthu P., 1977, Introduction to Solid Waste, in Effective Solid Waste Management, Editor: Agamuthu P. and Nather Khan, Ecotone Management Sdn. Bhd. Malaysia, pp.1-1 to 1-6.
• Kota Kinabalu City Hall, 2000, Integrated Solid Waste Management Strategy, Sustainable Urban management Project – Sabah, Project Funded by DANCED and Malaysian Government, Kota Kinabalu City Hall.
• Bartone, C. 2000. Strategies for Improving Municipal Solid Waste Management: Lessons from World Bank Lending and CWG Activities. Workshop on Planning for Sustainable and Integrated Solid Waste Management, Manila, 18- 22 September 2000. Washington, DC: Urban Management Division, World Bank


 (4 votes, average: 2.50 out of 5)


Leave your response!