
| GNSS | |
Geomagnetic Storms: Impact on GPS/GNSS signal delay over the low latitudes
This article demonstrates TEC results at low latitude Indian region, Bangalore (13.020 N, 77.570 E) and Hyderabad (17.410 N, 78.550 E) on the days of high intensity storms (October 29th, 2003), medium intensity storms (March 17th, 2013) and low/no intensity storms (July 05th, 2018 |
 |
|
 |
|
 |
|
Now a days more than hundred Global Navigation Satellite System (i.e. GPS, GLONASS, Galileo, Beidou, and IRNSS) signals are available everywhere all the time at free of cost. Hence, dependency on the GNSS technology has been increasing with more number of applications in almost all the fields for Position, Navigation and Time (PNT) estimation. The accuracy of GNSS in PNT estimation is being limited by various reasons one among them is dynamic nature of the ionosphere propagation medium which is extended approximately from 60-1000 Km above the earth surface.
One of the reasons for the dynamic nature of the ionosphere is Geomagnetic storms that occur in the interplanetary space. Moreover, an equatorial phenomenon is additional threat to the signals in low latitudes like India. A Geomagnetic Storm is a sudden and temporary disturbance of the Earth’s Magnetosphere caused by changes in the solar wind and interplanetary magnetic field (IMF). The disturbance in the interplanetary medium that drives the storms are due to a solar coronal mass ejection (CME) or a high speed stream (co-rotating interaction region or CIR) of the solar wind originating from a region of weak magnetic field on the Sun’s surface.
Also, the frequency of storms changes with Sun Spot Number (SSN). Most of the storms that occur during the solar maximum period are CME driven whereas the storms of solar minimum period are CIR driven. Storms lead to many changes in the plasma, magnetic and electric fields and currents in the Earth’s magnetosphere. However, the space weather description and characterisation of geomagnetic storm can be done by measuring the Disturbance Storm time (Dst) index and planetary geomagnetic disturbance index (Kp), Sun Spot Number (SSN), Solar activity, interplanetary magnetic field (IMF) etc. In order to demonstrate and describe impact of the Geomagnetic Storms, three days of different storm intensity levels have been chosen with the Kp index of 4 < Kp< 9 (29-10-2003), 2 < Kp < 7 (17-03-2013) 1< Kp< 5 (05- 07-2018). SSN for the corresponding days is 330, 126 and 0 respectively.
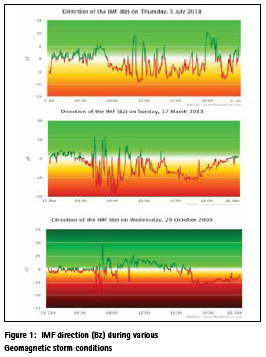
The interplanetary magnetic field direction (Bz) towards the south with values of -10 nT and lower are the indicators for the geomagnetic storm. Figure 1, shows IMF direction (Bz) for different storm days. On October 29th 2003, the geomagnetic storm began to develop at 5:58 UTC when the Bz dropped suddenly from 0 to -35.51 nT and within five minutes it turned to Bz: 5.07 nT at 6:03 UTC. Further it reaches minimum at 6:32 UTC, Bz: -53.85 nT and it reaches positive peak Bz: 34.86 nT at 6:44 UTC. The Bz value remains negative from 18: 11 UTC to 23:59 UTC. Also, the flares occurred on that day are C, M, and X type, among all more intense one is X10.0 flare that happened around 21:00 UTC and a good correlation could be observed between IMF and solar activity. For March 17, 2013 IMF direction (Bz) is less than -10nT was observed from 6:02 UTC to 9:10 UTC. But on the quiet day (July 5th, 2018) Bz value never reached to -10 nT so as to cause the storm.
One of the major effects of geomagnetic storm on GNSS signal is refraction, due to this signal spends an extra amount of time in the propagation medium and it can be expressed as,
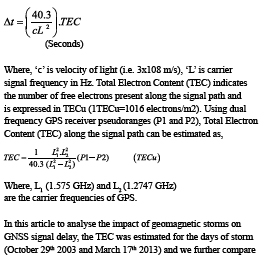
that of quiet day (July 5th 2018). The required dual frequency GPS receivers data was obtained from IGS network (http://sopac.ucsd. edu/dataBrowser.shtml) which was measured on frequencies (L1=1.575 GHz and L2= 1.227 GHz) at two low latitude stations (Bangalore (13.020 N, 77.570 E) and Hyderabad (17.410 N, 78.550 E)). GPS data obtained from IGS network is in hatanaka format. By using CRX2RNX tool data was converted into compact RINEX observation file format. For IISc-Bangalore station data is unavailable during 2.99 Hrs-3.50 Hrs and 12.74 Hrs- 13.25 Hrs on 17th March 2013.
Figure 2 and 3 shows the TEC variation of three different geomagnetic activity days at HYDE and IISC IGS stations. At each epoch, selected IGS stations are able to get signals from a minimum of eight satellites. Therefore, TEC is computed for all the available satellite signals and plotted with respect to time. For an instant, consider HYD IGS station on 29th October, 2003, during the mid-day at 10:00 UTC more signals are available and delay measured was not same for all the signals it is varied between 80 TECu and 330.15 TECu. This is because the signals received are at different elevation angles, the low elevation angle signals have long path so it faces more number of free electrons.
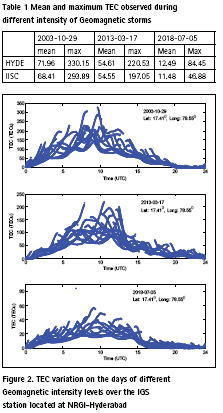
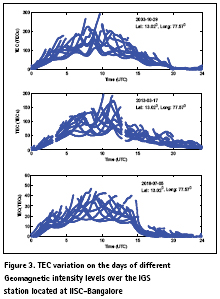
TEC introduces a delay of 0.165 meters for the L1 frequency and 0.248 meters for the L2 frequency. As expected, during daytime the TEC increased with time and has reached peak at 10 hrs (UTC) then decreased. During geomagnetic storms on (29- 10-2003 and 17-03-2013) significant enhancement in TEC is observed compared to the quiet day (05-07-2018), it is upto 390% at Hyderabad station and 260% at Bangalore station (Table 1). This drastic change in ionosphere TEC is due to the changes in the Earth magnetosphere. On storm days Kp-index, SSN, Solar flux are high further the solar flares are also high intense during storm days.
We can notice that during less/no intense storm, TEC maximum does not exceed 60 TECu. During main phase of the geomagnetic storm (29/10/2003) maximum TEC were observed over the selected low latitude stations Hyderabad (330.15 TECu ) and Bangalore (293.89 TECu ).
On the overall, we observe a good correlation between the ionospheric variations and intensity of geomagnetic storms. Storms induced ionosphere cause significant enhancement in TEC and also rapid changes. Therefore, the consequences of dynamic ionosphere such as time delay and scintillations degrade the performance of GNSS and other satellite based communication systems.
Acknowledgement
The research work presented in this article has been funded by the SAC (ISRO) under the NavIC-GAGAN Utilization Programme, Project ID: NGP-12, Dated: 23 January, 2017. Project title “Investigation of Indian Ionosphere Irregularities Correlation with Space Weather Parameters for Navigation Applications”.
References
http://sopac.ucsd.edu/dataBrowser.shtml https://www.spaceweatherlive.com


 (No Ratings Yet)


Leave your response!