Mycoordinates
coordinates


Estimates of anomalies in triangular area

Feb 2008 | Comments Off on Estimates of anomalies in triangular area

Sridevi Jade,Saigeetha A J,Vijayan M S M

 
This mega thrust earthquake of Dec 26, 2004 shifted several sites on Indian and Eurasian plates, which has been quantified from various GPS studies. As the relative change in triangular area between different sites is more sensitive than the relative change in their coordinates, it has been attempted to calculate the anomalies in triangular area on daily basis between 12 permanent GPS stations of C-MMACS and 16 IGS stations for a period of 60 days from 1st Dec 2004 – 30th Jan 2005.
   
figure_1

THE mega thrust Dec 26, 2004 Sumatra earthquake occurred due to thrust faulting on the interface of the subducting Indian and the overriding Burman plates. The rupture propagated 1300 km northwards within a duration of ~10 minutes at an average propagation rate of 2.1 km/s (Jade et al. 2005, Bilham et al. 2005). A large number of aftershocks followed the earthquake along the entire rupture plane for several days. GPS derived displacements indicate eastward motion of 12±3 mm and 6±3 mm at Bangalore (IISC) and Hyderabad (HYDE) IGS stations on the Indian plate due to this mega event. GPS sites in Northeast India suffered 3 to 5mm of southward deformation (Jade et al. 2007).

Northeast India is a highly complex tectonic zone bounded by Indo-Eurasian Himalayan thrust belt on the north and Indo-Burman range on the east. It lies far north of the Sumatra earthquake’s rupture line. The objective of this work is to estimate the daily change in the triangular area between the sites and to investigate the reason for the large sudden changes in the daily triangular area.

Gps data analysis and strain estimation

GPS Geodesy has been recognized in providing the most precise numbers for crustal deformation worldwide. Department of Science and Technology has launched a National GPS programme for monitoring crustal deformation due to earthquake occurrence and other geodynamic phenomena. As a part of this National programme CSIR Centre for Mathematical Modelling and Computer Simulation (C-MMACS), Bangalore established 12 permanent GPS stations and over 100 campaign stations across India in collaboration with various regional institutes to quantify intra-plate and inter-plate deformation in Indian subcontinent. The northeast network consists of 8 permanent stations whose details are given in Table 1. Other C-MMACS permanent stations used in the analysis are Bhopal (BHOP), Kodaikanal (KODI), Leh (RSCL), and Hanle (IAOH) (Table1, Figure 1). The IGS stations used in the analysis are also listed in same table and figure

Daily precise geocentric coordinates in XYZ Cartesian coordinate system for all the GPS sites obtained in ITRF 2000 reference Frame using GAMIT/GLOBK software were taken as the input for the estimation of areal strain for various triangles. The IGS stations Bangalore (IISC), Kunming (KUNM), Lhasa (LHAS), and Hyderabad (HYDE) along with the Northeast permanent network stations were used for triangular area calculations. The triangular area between a set of three stations each at one of its vertices were computed for the projection planes XY, YZ and ZX (Shinji et al. 2005).

Site   Latitude ( º )   Longitude( º )   Station Code
  Permanent GPS Sites
  Gauhati 26.15 91.66 GHTU
  Aizwal 23.72 92.73 AIWL
  Lumami 26.22 94.47 LUMA
  Bhopal 23.21 77.84 BHOP
  Shillong 25.57 91.85 SOS
  Tezpur 26.62 92.78 TZPR
  Bomdilla 27.27 92.44 BOMD
  Kodaikanal 10.23 77.47 KODI
  Imphal 24.75 93.92 IMPH
  Panthang 27.37 88.57 GBSK
  Hanle 32.77 78.97 IAOH
  Leh 34.12 77.6 RSCL
  IGS sites
  Bangalore 13.02 77.57 IISC
  Hyderabad 17.41 78.55 HYDE
  Kitab 39.14 66.89 KIT3
  Bishek 42.68 74.69 POL2
  Kunming 25.03 102.79 KUNM
  Lhasa 29.66 91.10 LHAS
  Almaty 43.18 77.02 SELE
  Bahrain 26.20 50.60 BAHR
  Cibinong -6.49 106.84 BAKO
  Coco -12.18 96.8 COCO
  Diego Garcia -7.26 72.37 DGAR
  Karratha -20.98 117.09 KARR
  Singapore 1.34 103.68 NTUS
  La Tampon -21.20 55.57 REUN
  La Misere -4.67 55.47 SEY1
  Wuhan City 30.53 114.35 WUHN

The daily change ratio ?Aj (Strain) of triangular area in each plane is given by

formulae

Where Aj is the area of the triangle for the jth day for j= 1 to 60

A MATLAB program was written for this purpose which can read an input file consisting of X, Y, Z geocentric coordinates of 3 stations with their corresponding errors. It then estimates triangular area projected in all three planes for all the available days and its daily change ratio (Strain) with errors. The estimated Strain values and respective errors are then plotted in PPM scale.

 
–~~~~~~~~~~~~–

Results and discussions

The results indicate no significant change in areal strain due to Dec 26, 2004 mega earthquake. This may be attributed to the fact that these sites are quite distant from the rupture plane. This can also be attributed to the almost constant relative shift in coordinates of the stations. But these results do show significant anomalies in the daily triangular area for some of the triangles for a particular day. After a detailed investigation we could map these anomalies to the local seismic events that have occurred within these triangles, the details of which are given below.

The GAUHATIKUNMING- AIZWAL (GHTU-KUNMAIWL) shows ( Figure 2) an areal strain of ~0.28 ppm on 9th Jan 2005 in XY projection plane where the average anomaly fluctuates between ±0.1 PPM. Similarly, all the three plane projections (XY, YZ and ZX) of GAUHATI-LUMAMI-AIZWAL (GHTULUMA- AIWL) show large anomalies of 0.2 PPM, -2 PPM and –0.1 PPM on 9th Jan 2005 where the threshold lies between ±0.1 PPM, ±1 PPM and ±0.025 PPM respectively. This may be due to the M4.7 shallow earthquake at 25.12ºN 98.86ºE with depth 36 km which occurred on 7th Jan 2005 [http:// eqint.cr.usgs.gov/neic/cgi-bin/epic/]. This event is within GHTU-KUNMAIWL triangle and closer to GHTULUMA- AIWL triangle (Figure 2). This indicates possible contraction in GHTUKUNM- AIWL and GHTU-LUMAAIWL triangular area (XY plane).

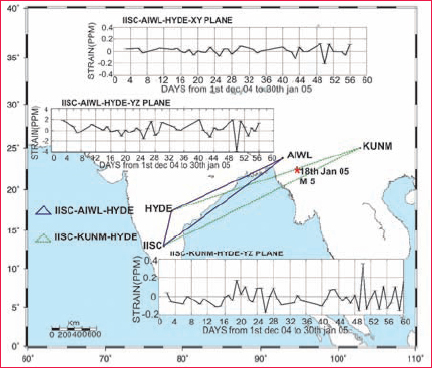
Similarly, IISC-AIWL-HYDE (Bangalore- Aizwal-Hyderabad) shows (Figure 3) a dilatational strain of –0.22 PPM and –4.25 PPM in XY and YZ planes on 19th Jan 2005 where the threshold lies within ±0.1 PPM and ±2 PPM respectively. A compressional strain of 0.38 PPM is traced in YZ plane of IISC-KUNM-HYDE on 19th Jan 2005. This may be due to M5.0 earthquake (Depth = 104 km) at 22.97ºN 94.70ºE on 18th Jan 2005 [http://eqint. cr.usgs.gov/neic/cgi-bin/epic] in Central Burman Molasse Basin (Figure 3). The Central Burman Molasse Basin lies within IISC-KUNM-HYDE triangle and closer to IISC-AIWL-HYDE triangle.

ghtu-iuma

Figure 2: anomalies in the daily triangular area of GHTU-lUMA-aIwl triangle, GHTU-KUNM-AIWl triangle and the corresponding strain (PPM)

kunm-hyde

Figure 3: anomalies in the daily triangular area of IIsc-aIwl-hyde triangle, IISC-KUNM-HYDE triangle and the corresponding strain (PPM)

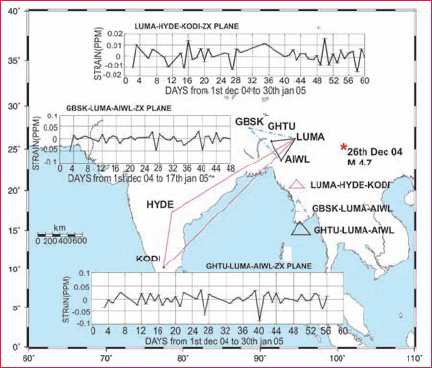
All triangles involving Lumami (Figure 4) at one of their vertices such as LUMAHYDE- KODI, GBSK-LUMA-AIWL, and GHTU-LUMA-AIWL show a slightly high dilatational strain on 27th Dec 2004 in ZX projection plane. The probable source of this deformation is M4.7 tremor of shallow depth 66 km at 24.85ºN 101.69ºE which occurred very close to Lumami and Kunming on 26th Dec 2004 (Figure 4).

The error values have been computed for the areal strain computations of all the triangles and are found to be insignificant when compared to the anomalies. The rest of the triangles do not show any significant daily change ratio.

gbsk-luma

Figure 4: Anomalies in the daily triangular area of LUMA-HYDE-KODI triangle, GBSK-LUMA- AIWL triangle, GHTU-KUNM-AIWL triangle and the corresponding strain (PPM)

Conclusion

As the relative change in triangular area between stations gives dilatational strain which is more sensitive than the relative change in coordinates, such a study can be utilized for a better understanding of deformation of a region due to local tectonic events. This analysis when done on a daily basis at all GPS permanent sites would generate long time series of strain in XY, YZ and XZ planes which would give more insight in to the deformation regime in the region. These strain changes
in the region can then be related to the focal mechanism of local events which may give further insight in to complicated regional deformation processes.

References

* Bilham, R., Engdahl, R., Feldi, N., Satyabala, S. P., 2005, “Partial and Complete Rupture of the Indo-Andaman Plate Boundary 1847-2004”, Seismological Research Letters, 76, pp. 299 – 311.
* Jade, S., Vijayan, M. S. M., Gupta, S. S., Kumar, P. D., Gaur, V. K., Arumugam, S., 2005, “Effect of M9.3 Sumatra Andaman Islands Earthquake of 26th December 2004 at Some Permanent and Campaign Stations in the Indian Continent”, International Journal of Remote Sensing, Vol. 28, Nos. 13-14, July 2007, 3045-3054.
* Jade, S., Ananda, M, B., Kumar, P. D., Banerjee, S., “Coseismic and post- seismic displacements in Andaman and Nicobar Islands from GPS measurements”, Current Science, 88, pp. 1980-1984.
* Murai, S., Araki, H., July 2005, “Was Early Warning of Sumatra Earthquake Possible?”, Coordinates pp. 8 – 11.


Sridevi Jade

CMMACS,
Bangalore
sridevi@cmmacs.ernet.in
   

Saigeetha A J

CMMACS,
Bangalore
   

Vijayan M S M

CMMACS,
Bangalore


My coordinates
EDITORIAL
 
News
INDUSTRYLBS | GPSGIS  | REMOTE SENSING | GALILEO UPDATE
 
Mark your calendar
May 09 TO DECEMBER 2009

«Previous 1 2View All| Next»

Pages: 1 2

1 Star2 Stars3 Stars4 Stars5 Stars (No Ratings Yet)
Loading...