| GIS - New | |
Decision support system for engineering structure supervision
The work presented in this article is through the integration of multidimensional and spatial analysis in the management of a network of auscultation for monitoring structures |
 |
|
The safety of engineering structures requires periodic inspection. Assessing the condition of the structure and its behavior cannot be done without a regular and frequent monitoring by establishing a network of geometric auscultation. The contribution of an analytical tool in the management of this network is the purpose of this work.
The idea is to propose an interactive decision support system by integrating GIS and OLAP technology to take advantage of each to ensure better multidimensional and space analysis to facilitate decision making. It will therefore be to combine the technology of geographic information systems for the treatment of geographic data and map viewing with exploration and analysis tools OLAP, this achievement involves many concepts and techniques. The practical application of our work lies in the field monitoring of engineering structures, the data used to illustrate our contributions concern the geometric network auscultation of the GL4Z storage tank.
Introduction
Engineering structures such as storage tanks are constantly prone to deformations and displacements under the constraints of internal and external loads acting on structures. To ensure safety, prevent costly damage, check the criteria of construction and follow their behavior in general, an accurate assessment of their travel time is needed for this, the basic geodetic measurements that are the determination on a given date, the position of points in a network established on the study site is applied. Thus, their relative displacements are used to define the deformations of the ground. The framework put in place for periodic monitoring of tanks, is presented as a tool for monitoring and prevention of risks that might arise while determining the positions of the targets to quantify their movements compared to a known initial position to reach a decision.
The effectiveness of this decision is based on the provision of relevant information and tools. Management systems of traditional data will be inappropriate for the activity of decision making. To overcome this drawback, systems decision supports have been developed and whose main objective is to allow a user to access data simply and enhance the information retrieved.
The objective of this work is to propose a decision-making approach to surveillance (geometric auscultation) work of art based on the concept SOLAP (Spatial On Line Analytical Processing), which opens up new possibilities for managing and exploring data.
The work presented in this article is through the integration of multidimensional and spatial analysis in the management of a network of auscultation for monitoring structures.
Auscultation
Auscultation includes all devices for measuring physical quantities may change in time, so as to highlight its behavior and the evolutionary significant aging. To do this, we proceed to measure displacements, strains, stresses, pressures, flow rates … etc. Among these methods, we find the geometric auscultation.
Measures auscultation structures are of great importance. They have in fact two main goals:
• Check the stability of the structure and prevent major risks trained by his break
.• Track the behavior of the structure in time, i.e. quantify the displacements and deformations of parts or all of the item.
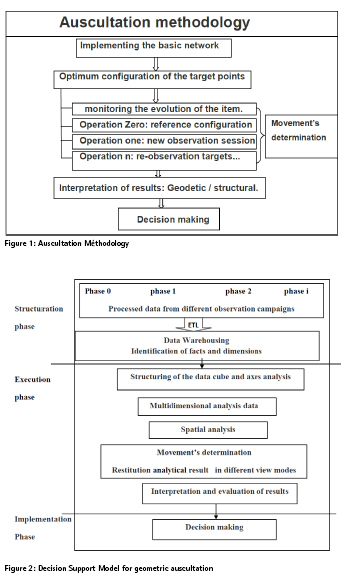
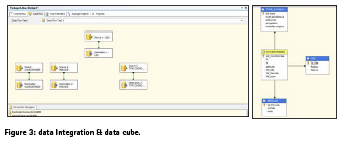
Based on the geometric elements of auscultation as place on the ground, we proposed decision model shown in Figure (1). This model follows the steps of the decision-making approach of Pictet. Figure (2) summarizes the different steps of the structuring phase, operation and implementation.
Structuring phase model
In this phase, the surveillance data from different observing campaigns undergo a series of treatments in a process data warehouse ETL (Extract, Transform, Load) and then integrated into a single data warehouse.
The relational database is structured according to a particular model called star model which takes its name from the configuration object containing a central fact table named connected to a number of objects radially called dimension tables that contain attributes defining each dimension members. The data store is a Data Mart or localized implantation of a data warehouse for single use. Its dimensions are chosen according to the needs of our application and the desired measurements and included in the client application.
Operational phase of the model
The data are presented as a multidimensional view before presenting them to the client module with different display modes:
Graph: tabular, histograms or pie;
Cartography by a geographic information system.
The OLAP tool used for navigation in the data warehouse. In the OLAP tool, data is imported from transactional systems and restructured into a cube, through dimensions. The imported data stores must be organized in a model facilitating the decision and suitable for analysis tools.
The multivariate analysis allows knowing, measure and forecast (decision) through the manipulation of data store. We can consider several handling operations:
– Consultation of table data and generate graphs;
– Requêtage graph on a database;
– Application of multidimensional operators. Spatial analysis is an essential activity for mapping and decision making. GIS used for spatial analysis. It remains a tool in the decision making process and it becomes a tool integrator providing clear and accurate information to decision makers to make a more just and enlightened. GIS is currently the best tool for digital geographic information and definition, especially as this analysis tools.
Phase of implementation of the results
This phase focuses on the interpretation of results of analysis and knowledge discovery in order to facilitate the taking of the decision.
Figure (2) presents an overview of the proposed decision-making process for inspecting geometric aims to facilitate decision making. System of Interactive Decision Support (DSS) adopted this approach based on OLAP engine which is the center of the model and gives back the tables and charts, as well as results from mapping the spatial analysis.
The suggested approach to decision making is structured according to the three stages of Pictet, namely the step of structuring, operating and implementation.
The proposed decision model will serve as a monitoring system for the interpretation of geodetic results following trends deformations and displacements using geo-technologies more advanced decision (Datawarehouse, Data mart, GIS OLAP cube and SOLAP).
Case study
Our model monitoring work of art oriented solution SOLAP belongs to the whole vast field of applications of decision support, particularly from the field of Business Intelligence.
Indeed, the architecture of our system decision support is that of a purely OLAP architecture while integrating spatially referenced data at different levels of application components.
The decision model proposed allows the exploitation of the data cube for spatio-temporal analysis based on the different dimensions temporal, geographical and thematic.
Presentation of the tank frozen ground
The tank frozen ground LNG terminal complex SONATRACH GL/4Z Arzew was built in 1964 and has a capacity of about 38,000 m3. It accounted for the complex more than 50% of its storage capacity. The tank has a diameter of 37.20 meters and a depth of 36 meters and is situated 100 meters from the sea. The main characteristic of this type of storage is the lack of insulation and moisture barrier on the vertical walls and the bottom. Only the gel of the water contained in the soil ensures impermeability. This type of storage can be heated without destroying itself. Problems encountered in the operation of this type of storage are of different types: natural
• Problems (deformations of the tank and its immediate vicinity).
• Structural problems (disorders at the structure supporting the roof of the tank). The origins of these problems are mainly related to the nature of the soil, the proximity of the sea and the progression of freezing front.
Methodology of the tank auscultation
This type of tank is well suited to auscultation GPS where all the precision of this technique standard (SD = 5mm ± 1 ppm) can be exploited. Auscultation methodology for this type of tray is as follows:
Implementation of basic network choice points near the work sites and stable materialization terminals concrete. The altitude of the base stations was chosen almost identical to that of the tank to minimize the influence of the troposphere.
- Optimal targets:
– Number and homogeneous distribution of target points: according to the shape and type of structure by a suitable mesh (structural mechanics).
– Sustainable Materialization points.
• Monitoring the evolution or stability of the structure:
– Operation 0: observation in static or rapid static and determining the coordinates of the target points. The positions of these points from the backbone are the reference pattern. – Operation i: determining the positions of target points from a new campaign GPS observation to quantify the displacements of the structure relative to the reference configuration. The new configuration thus determined (step i) serve as a reference configuration for the next operation auscultation (i +1). The frequency response varies the amplitude of the deformations, the speed of movement of the tray and in response to events (such as earthquakes, landslides …).
• Interpreting results:
– Geodetic Interpretations: following trends deformations and displacements.
– Structural Interpretations: integrate other data (permeability, soil consolidation pressure, isotherms, internal inspection of the tank by endoscopy, etc.)
Structuring phase
This first phase goes into the process of data warehousing (datawarhousing). We adopt in the following decision-making approach to monitoring by auscultation geometric proposed in the case of storage tank excavation of LNG. Informational part of our study is represented by data from 04 observational campaigns.
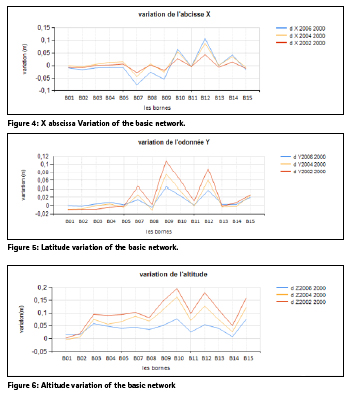
Microsoft Integration Services is a platform that allows you to create high-performance solutions for data integration, including extraction, transformation and loading (ETL) packages for data warehousing (Data Warehousing).
Through a process of data warehouse ETL (Extract, Transform, Load), data will undergo a series of treatments before stored in a single data warehouse: Data will first be extracted from each data source to be cleaned and homogenized. These data will become, therefore, the same target format to be finally loaded into the ED.
Operational phase
Multidimensional analysis
Browsing the Cube
Once the cube is deployed, it is possible to display the data cube tab Browser (Browser) Designer cube and dimension data browser tab of Dimension Designer. Navigation is a term used to describe the process used to explore a cube interactively, usually by using a graphical OLAP client connected to an OLAP server. The process for user interactive multidimensional query is called “slicing” and “dicing”. The result of a query is either a multidimensional cell, a “slice” two-dimensional or multi-dimensional subcube.
Determining the displacements of the network
The MDX language, developed in the laboratories Microsoft is a query language for multidimensional databases more suitable than conventional SQL query processing OLAP type. MDX stands for “Multi-Dimensional Expressions”. To calculate the various movements during the observation periods, we execute some MDX queries:
Restitution analysis results
A data warehouse should allow locate and retrieve information, to store and query, analyze and enrich, and provide visualization tools and reporting. This tool is based on a multidimensional interaction enables fast and intuitive to navigate through the information.
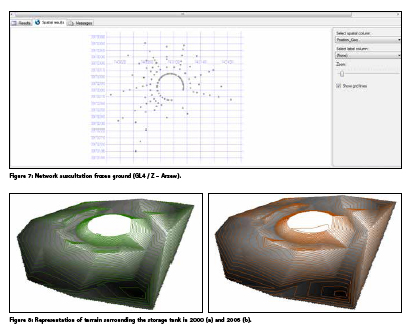
Figures 4, 5 and 6 illustrate the variations of the basic network in X, Y and altitude:
Spatial analysis
Spatial analysis is an essential activity for mapping and decision making.
In a geographic database (GDB) many information is not explicitly represented. Typically, this information may be reconstructed by the human eye when reading a map, as the relationship between objects “is near.” The reconstruction of these relationships must meet various levels of analysis corresponding to different scales meaningful objects and phenomena that are the arguments. Spatial analysis aims to clarify these relationships.
The spatial analyses determine the spatial distribution of a variable, the relationship between the spatial distribution of the variables and the association thereof to a geographical area.
Spatial analysis refers to the analysis of a distributed phenomenon in space which also has the physical dimensions (the location, proximity, etc. …)
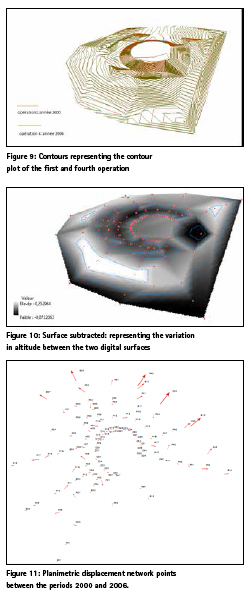
To arrive at a more convenient comparison, a superposition of the contour isolines of the two periods and a surface map subtracted from the differences between the two digital surfaces were performed.
Figures represents the change in altitude and therefore the significance of the deformations of the study area in terms of compaction and swelling, it is important at the white surface, and reaches 252 mm. These numerical models constructed from our data are close to a three-dimensional reality on the ground to identify the most significant characteristics of the landforms of the area surrounding the tank.
Figure (11) shows that the majority of the network points of auscultation of the tank in frozen soil are subject to a phenomenon of horizontal displacement in the direction north-east. The maximum value of the displacement is of the order of 163 mm.
Comparison of the results obtained during four campaigns of GPS observations helped highlight the movements of the order of 163 mm in plan and 252 mm altimetry.
Conclusion
This work is a contribution to the monitoring work of art on possible technological responses to better control and understanding of risk exposure, this study is within the framework of systems decision support. This approach adopts dimensional modeling data organized in a manner appropriate to analysis to an analytical study of advanced data, providing an effective decision support. Another category of tools derived from the first, is also booming. It is SOLAP tools that combine the analytical power of OLAP tools with visualization capabilities maps. At first it was necessary to develop a decision model dedicated to the monitoring work of art by auscultation geometry. The suggested approach to decision making is structured according to the three stages of Pictet. Our application focused on auscultation network storage bin GL4Z established to monitor this very special book. Information from the 04 observation periods emerge as a decision-making element of the first order, and the ability to manage and use it wisely is a substantial contribution of new information technologies to help achieve the objectives the decision. This application allowed us good management of the time dimension, the addition of calculated measures, filtering on dimension members, exploration operations and flexible management of cartographic, tabular and graphical displays.
References
1. Bedard, 2002. Advanced GIS database concepts. Part 1: Basics of GIS. Centre for Research in Geomatics. Laval University, Quebec. 10-11 June 2002.
2. Derkaoui Aicha, Ghezali Boualem, 2009. Integration of multivariate analysis in the management of a network of auscultation. Review XYZ No. 118
3. Chakher Salem, 2006. multicriteria decision mapping: formalization and computer implementation. PhD in computer science. University of Paris Dauphine.
4. Taibi & al, 2008. Auscultation of the storage tank in excavation liquefied natural gas GPS. Review XYZ No. 117.
5. Zemri, 2011. Towards Interactive System Decision Support for the Epidemiological Monitoring. Magister memory, computer expertise. University of Oran.


 (No Ratings Yet)


Leave your response!