| Applications | |
Covid-19 Lockdown 1.0 and Air Pollution in north-western India using Sentinel 5P
The paper analyses air quality through three parameters namely aerosol (AER), which is broadly referred as dust & smoke, nitrogen dioxide (NO2) and carbon monoxide (CO) retrieved from Sentinel 5P satellite mission during first week imposition of Covid-19 Covid-19 Lockdown 1.0 by comparing multiple time-series satellite data of 2019 & 2020 and supplemented by ground measurements. |
 |
|
The paper explores to analyse the spatio-temporal pattern of air pollution during Covid-19 Lockdown 1.0, which witnessed high decline in pollutants such as particulate matter, NO2, Carbon Monoxide (CO) in northwestern states of India. The region had attracted global attention including the Supreme Court of India and Hon’ble Prime Minister of India apart from others during last winter of 2019, when air quality was considered to be above hazardous level. The nation-wide “Janta Curfew” followed by 21-day lockdown to combat the coronavirus outbreak in the country led to travel restrictions and closure of industries & construction activities, which showed improvement in air quality throughout the region. An attempt has been made to assess the decline in air pollutant through the time series data of Sentinel-5 Precursor satellite – also known as Sentinel-5P, which is the first Copernicus mission dedicated to monitoring our atmosphere. The satellite carries the Tropomi instrument (TROPOspheric Monitoring Instrument) to map a multitude of trace gases such as nitrogen dioxide, ozone, formaldehyde, sulphur dioxide, methane, carbon monoxide and aerosols – all of which affect the air we breathe and therefore our health, and our climate. The paper analyses air quality through three parameters namely aerosol (AER), which is broadly referred as dust & smoke, nitrogen dioxide (NO2) and carbon monoxide (CO) obtained from Sentinel 5P satellite mission during Lockdown 1.0. Further two reference data of last year 2019 was also taken into analysis.
Background
India imposed a nationwide lockdown on 22nd March 2020 to stop the spread of the coronavirus Covid-19. But this lockdown seems to provide temporary relief in another pressing health issue i.e. air pollution. During the world’s largest lockdown, public transport, which is considered to be the main source of air pollution in most of the Indian cities, all factories, market, shops and construction works remain suspended since 22nd March 2020. During the last year, according to World Air Quality Report, 21 of the world’s 30 cities with worst air pollution were in India. Ghaziabad, a satellite city located in the national capital region (NCR) in north-western Uttar Pradesh state, was ranked as the world’s most polluted city. In view of above, it was decided to analyse the atmospheric concentration of air pollutants such as particulate matter (PM) in the form of Absorbing Aerosol Index (AAI), nitrogen dioxide (NO2) and Carbon monoxide (CO) retrieved from Sentinel 5p satellite mission.
Recent Sentinel 5P data have shown a decline in air pollution over northwestern India coinciding with its nationwide Lockdown 1.0 to prevent the spread of the coronavirus (COVID-19) during the last week of March 2020. This led to the dramatic reduction in the concentration of particulate matter and other trace gases such as nitrogen dioxide & carbon monoxide. As per the study by Central Pollution Control Board (CPCB) released on the impact of “Janta Curfew”, out of 91 cities as many as 30 cities recorded ‘good’ air quality while 61 cities recorded ‘satisfactory’ air quality. Moreover the number of cities recording poor to severe air pollution also came down from 9 (March 21) to 0 (March 29), which were unprecedented.
This is worthwhile to note that during November 2019, a public health emergency was declared after the air quality index (AQI) level exceeded 800 in certain parts of New Delhi, which was more than three times the “hazardous” level. Experts say that reduced fossil fuel emission due to transport sector and slowdown in other emissions-related activity has contributed in reduction in air pollutants during lockdown 1.0.
Delhi, parts of western Uttar Pradesh, Haryana, Punjab have traditionally been hot-spots of high concentration of particulate matters and smoke. This was mainly due to emission from transport sector and burning of crop residues in neighbouring areas.
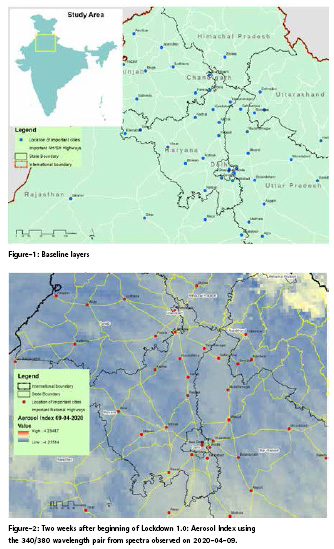
The study area and methodology
The study area of north-western India is loosely comprised parts of India consisting of Punjab, Haryana, Delhi, parts of Rajasthan, Uttrakhand, southwestern parts of Himachal Pradesh and western Uttar Pradesh. This part loosely constitutes main lands of National Capital Region (NCR) and beyond.
Multi time-series Sentinel 5P Satellite data (dated 31st October 2019, 20th March 2020, 28th March 2020 & 2019 and 31st March 2020) were processed from https://s5phub.copernicus.eu. Further these data were rectified and analysed in panoply and SNAP desktop softwares. In addition other requisite vector data were obtained from other secondary sources.
The satellite & sensor – Sentinel-5 Precursor and TROPOMI
The Sentinel-5 Precursor – also known as Sentinel-5P – is the first Copernicus mission dedicated to monitoring our atmosphere. The satellite carries the Tropomi instrument to map a multitude of trace gases such as nitrogen dioxide, ozone, formaldehyde, sulphur dioxide, methane, carbon monoxide and aerosols.
The Sentinel-5 Precursor (S5p) mission is a low Earth orbit polar satellite system to provide information and services on air quality, climate and the ozone layer. The S5p mission is part of the Global Monitoring of the Environment and Security (GMES/COPERNICUS) space component programme. The S5p mission consists of a satellite bus, the payload consisting of the TROPOspheric Monitoring Instrument (TROPOMI), and a ground system. TROPOMI is a nadir viewing shortwave spectrometer that measures in the UV-visible wavelength range (270 – 500 nm), the near infrared (710 – 770 nm) and the shortwave infrared (2314 – 2382 nm). The instrument uses passive remote sensing techniques to attain its objective by measuring at the top of the atmosphere the solar radiation reflected by and radiated from the Earth. The instrument images a strip of the Earth on a two dimensional detector for a period of approximately 1 second during which the satellite moves by about 7-km. This strip has dimensions of approximately 2600km in the direction across the track of the satellite and 7km in the along-track direction.
TROPOMI is intended to make daily global observations of key atmospheric constituents, including ozone, nitrogen dioxide, sulphur dioxide, carbon monoxide, methane, and formaldehyde as well as cloud and aerosol properties. On 13th October 2017, the Copernicus Sentinel 5 Precursor (S5P), the first of the European Sentinel satellites dedicated to monitoring of atmospheric composition, was launched.
The mission objectives of S5P are to globally monitor air quality, climate and the ozone layer in the time period between 2017 and 2023. The first 6 months of the mission were used for special observations to commission the satellite and the ground processing systems; the operational phase started in April of 2018.
Results and discussion
Particulate matter through UV Aerosol Index Product
The Aerosol Index described is called the UVAI since it is based on spectral contrast in the ultraviolet (UV) spectral range for a given wavelength pair, where the difference between observed and modelled reflectance results in a residual value. When this residual is positive it indicates the presence of UV-absorbing aerosols, like dust and smoke (from both biomass burning and volcanic sources),and is often referred to as the Absorbing Aerosol Index (AAI).
The relatively simple calculation of the Aerosol Index is based on wavelength dependent changes in Rayleigh scattering in the UV spectral range where ozone absorption is very small, i.e. wavelengths longer than about 340 nm. For a given wavelength pair a ratio is calculated from measured top of the atmosphere (TOA) reflectance and pre-calculated theoretical reflectance for a Rayleigh scattering-only atmosphere and results in a residual value. Positive values of this residual indicate the presence of UV-absorbing aerosol.
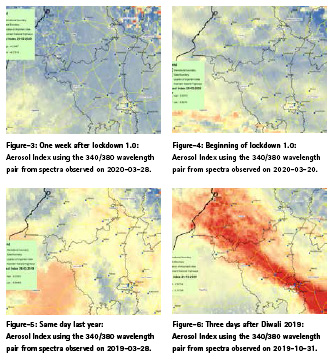
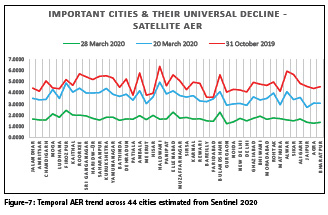
Spatio-temporal analysis of sentinel 5p satellite data indicate that there are visible improvement in air quality in the study area. It is obvious that there is perceived decline in the concentration of aerosol during the first week of COVID-19 lockdown (Refer Figure-2 &3). It is visible that area having yellow-white patches over cities indicate the presence of dust and smoke, which seem to be absent in the image dated 28th March 2020.
Further it is observed from the Figure -5, that on the same date of 28th March during 2019, there was higher concentration of particulate matter over the region. Further during October 2019, there observed to be much higher concentration of particulate matter as is evident from Figure-6. The high concentration of AER image is due to the fact that Diwali festival was held on 27th October 2019.
Spatio-temporal change vis-à-vis important towns in the region
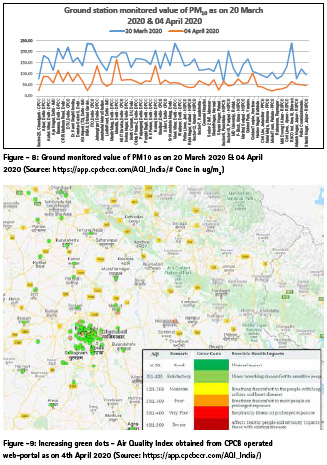
A total of 44 cities were plotted in Figure -7 depicting aerosol index values of respective images of sentinel 5p of different time period as on 31st March 2020, 20th March 2020 and 31st October 2019 were were manipulated against a simple positive Y axis to visualise the changes.
The figure -8, which plots the two time series ground monitored values of 20th March 2020 & 04th April 2020 retrieved from the Central Pollution Control Board (CPCB) and respective State Pollution Control Boards/Committees (SPCBs) ground monitored result on CPCB operated web-portal also supplement the trend highlighted from the three time-series satellite imageries.
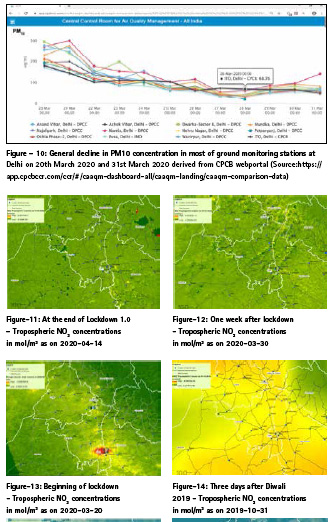
Air quality index map as per Figure-9 also indicates the presence of good air quality as on 04th April 2020 all across the region. Figure-10 demonstrates the general decline of PM10 concentration in most of the monitoring locations in Delhi.
The Nitrogen Dioxide (NO2) concentration
TROPOMI NO2 data product gives trace gas concentrations in mol/ m2. As nitrogen dioxide is primarily produced by road traffic, power plants, other factories and fossil fuel or biomass burning processes. It is a first-level indicator of industrial activity worldwide.
What is clearly visible is a significant reduction of nitrogen dioxide levels over north-western India, caused by reduced activity due to COVID-19 restrictions. NO2 has a short lifetime so that concentrations are larger over land than in the cleaner air over the oceans.
The largest concentrations are found over industrial and urban regions. We can certainly attribute a part of the nitrogen dioxide concentration reduction to the impact of the coronavirus lockdown.
From above images, it emerges that NO2 level is observed to be universally low across region one week after the coronavirus lockdown and there is no spatial city-specific concentration pattern related to anthropogenic activities around the region. However there is a perceived decline in concentration of nitrogen dioxide especially in and around Delhi. The image dated 31st October 2019 reveals a completely different picture as NO2 concentration is observed to be slightly high in parts of Delhi, western UP, Haryana and Punjab.
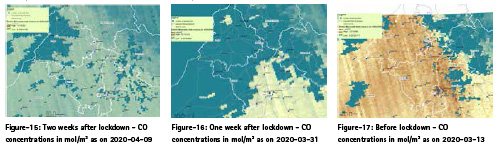
Carbon monoxide (CO) concentration
Carbon monoxide (CO) has natural and anthropogenic sources. It is emitted from soils, plants and the ocean, but its main sources are incomplete fossil fuel and biomass burning. It is also produced by oxidation of CH4 and other hydrocarbons. The highest CO concentrations are found some parts areas of western Uttar Pradesh, Haryana and Punjab (Refer Figure-17). CO has a lifetime of several weeks and can serve as a tracer for regional and inter-continental transport of polluted air. However the CO concentration seem to demonstrate reduction in concentration in most of Punjab, Haryana and other areas as well as are evident in Figure-15 & 16.
Conclusion
Measurements from the European Space Agency’s (ESA) Sentinel 5P satellite show that during Indian Lockdown 1.0, concentration of aerosol and nitrogen dioxide over north-western India has declined significantly. As new cases of Covid-19 coronavirus rose to 11,154 at the end of Lockdown 1.0, air pollution plummeted to the satisfactory level across region.
The improvement in air quality of the study area has been established across all cities in terms of AER, NO2 and CO parameters of sentinel 5p. The area has a number of cities in the region where most of the vehicles remained off road and non-essential industrial units closed during nation-wide lockdown. Most of the these cities, which have high population density and substantial share of emissions from transport sector, showed significant improvement in air quality values with levels moving from higher to lower end of category of Air Quality Index, which is amply supported by ground monitored values of Central & State Pollution Control Boards.
The recent improvements in air quality could be made permanent by replacing fossil fuel generation with renewal energy and other low carbon sources. The ensuing lockdowns have shown the improvements to air quality that are possible when emissions are reduced on a regional/global scale.
(Note: View expressed in the paper is independent of institutional affiliation of the author.)
References
[1] Arnoud Apituley, Mattia Pedergnana, Maarten Sneep, J. Pepijn Veefkind, Diego Loyola, Deborah Stein Zweers, 2018: Sentinel-5 precursor/ TROPOMI Level 2 Product User Manual UV Aerosol Index.
[2] Henk Eskes, Jos van Geffen, Folkert Boersma, Kai-Uwe Eichmann, Arnoud Apituley, Mattia Pedergnana, Maarten Sneep, J. Pepijn Veefkind, Diego Loyola, 2018: Sentinel-5 precursor/ TROPOMI Level 2 Product User Manual Nitrogendioxide
[3] https://app.cpcbccr.com/AQI_India/
[4] Hadjimitsis DG (2009) Aerosol optical thickness (AOT) retrieval over land using satellite imagebased algorithm, Air Quality. Atmosphere & Health-An International Journal 2: 89-97.
[5] IMPACT OF JANTA CURFEW & LOCKDOWN ON AIR QUALITY, Central Pollution Control Board (Ministry of Environment, Forest and Climate Change) Govt. of India, Delhi https://www.cpcb. nic.in/air/NCR/jantacurfew.pdf
[6] Retalis A, Cartalis C, Athanassious E (1999) Assessment of the distribution of aerosols in the area of Athens with the use of Landsat Thematic Mapper data. Int J Remote Sensing 20: 939-945.
[7] Ung A, Wald L, Ranchi T, Weber C, Hirsch J, et al. (2003) Air pollution mapping: relationship between satellite made observation and air quality parameters. 12th International Symposium, Transport and Air Pollution, Avignon, France.
[8] Ung A, Weber C, Perron G, Hirsch J, Kleinpeter J, et al. (2001) Air Pollution Mapping over a City – Virtual Stations and Morphological Indicators. 10th International Symposium “Transport and Air Pollution”, Colorado, USA.
[9] Wald L, Baleynaud JM (1999) Observed air quality over city of Nantes by means of Landsat Thermal Infrared data. International journal of Remote Sensing 20: 947-959.
[10] WHO (1999) Air Quality Guidelines. Protection of Human Environment, World Health Organization, Geneva.
[11] WijeratneI K, Bijker W (2006) Mapping Dispersion of Urban Pollution with Remote Sensing. International Archives of Photogrammetry, Remote Sensing, and Spatial Information Sciences 34: 125-130.


 (2 votes, average: 3.50 out of 5)


Leave your response!