| Applications | |
A comparison of fuzzy logic based and artificial neural network approach to urban planning issues
This work is an attempt to review the two approach and the context which gives better result for each of the method |
 |
|
 |
|
 |
|
 |
|
Artificial intelligence is useful in solving urban planning challenges. Fuzzy logic, neural networks combined with geographical information system and sometimes Cellular automata can be very effective in simulating different aspect of the urban planning problems. They can integrate rule based definition with explicit, interactive and heuristic decision making processes. This work is an attempt to review the two approach and the context which gives better result for each of the method. The methodology employed is simple, a good numbers of journal papers were reviewed comprehensively, some of the papers were fuzzy logic based, some others were neural network based and the last sets of papers combined both fuzzy logic and neural network in solving urban planning problems. Based on the analysis and results obtained, it is recommended that depending on the nature of the problem, a combination of the both approach will give the best result.
Introduction
Spatial data analysis is very essential part of urban planning and management. Most of the data used in urban and regional planning and the assessment of economic, environmental and social sustainability of a city or region have a spatial component, as economic and human activities occur in space and time. Influence of economic and human activities on the regional landscape is neither well defined nor uniform (Manca andCurtin2012). Some of these data are also inherently ambiguous, as urban planning is a democratic process involving inputs, usually in the form of verbal communication, from participants with diverse interests and values (Feng and Xu 1999). Spatial vagueness, interpersonal differences in perception and imperfect information create uncertainty in spatial information. While researchers have argued that issues related to vagueness, imprecision and ambiguity inhuman judgement should find a proper place in the formal planning and evaluation process (Feng and Xu 1999), there is a challenge in processing such data, especially in the geographic information system, for urban planning. ‘Traditional Boolean logic, which is crisp, deterministic, and precise in nature’, implicitly assumes that objects in spatial database and their attributes can be uniquely defined. It does not model the fuzziness, uncertainties and imprecision in geographic information and human decision-making processes (Sui, 1992). Hence, the integration of GIS and fuzzy set theory has practical significance in spatial data analysis for urban and regional planning. There have been considerable applications of fuzzy system in urban planning, such as applications for defining landscape regions, urban design, evaluation of accessibility to urban services, transportation modelling, transportation management and operation optimization, ecological planning and sustainable development.
Ambiguity in urban planning
Urban planning and regional planning is a complex process. There is the need to evaluate planning decision using the environmental, physical, social and financial conditions and effects using data that are qualitative and quantitative in nature. ‘’It is a decision making process involving stakeholders with diverse socioeconomic and political backgrounds and interests. Consequently, it is a process of integrating and balancing’’
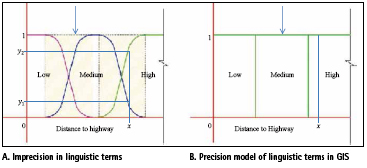
‘Binay Adhikari & Jianling Li (2013) noted that “the current Boolean logic used in conventional GIS software lacks the capacity of modelling ambiguity as demonstrated in Figure 1. In this example, X-axis is the distance to highways while Y-axis is the level of certainty in categorizing distance to highways in three classes: high, medium and low. Figure 1A shows the imprecision in linguistic definition of proximity to highway in the three classes illustrated in the pink, blue and green lines. Figure 1B shows how Boolean logic in GIS models the linguistic classification into precise and crisp categories. Assuming a symmetrical distribution of data, linguistic definition of proximity to highway by nature contains data with various degrees of uncertainty as shown in the shaded area. The data complexity is further illustrated in Figure 1A, where distance x can have two different values, y1 and y2, representing its degrees of certainty that simultaneously exist in different categories. However, Boolean logic in GIS handles such uncertainty by classifying the imprecise data into three categories with 100% certainty. Although classifying the distance into numerous categories can be done to create more refined gradual results, it is time consuming and ineffective in modelling data variation. Fuzzy logic adds two important advantages to analysing ‘imperfect information’. First, it models vagueness inherent in linguistic arguments. Secondly, it models fuzziness in defining categories wherein one entity can fall simultaneously in more than one category. ‘Imperfect information is information which in one or more respects is imprecise, uncertain, incomplete, unreliable, vague, or partially true.
100% certainty
Why fuzzy logic in spatial analyses and urban planning
Fuzzy logic is important in planning because planning is carried out within a multi-judgment, multivalued, multiobjective process or environment, it needs to meet certain specifications of the fuzziness in that environment. ‘’An environment with a multi-objective, multivalued, and multi-judgment nature needs to take into account the influential or intervening factors and to give them a share in its equations’’. ‘’Otherwise, it will be accused of eliminating some influential factors from the list of those intervening on an arbitrary and selective basis. And this compromises its legitimacy and justifiability’’.
The process of contemporary planning involves a great deal of coordination, modification, justification, and reconciliation. The large number of stakeholders and beneficiaries as well as the vast number of involving factors makes almost every initial plan, planning decision, or even policy subject to reconsideration. This reconsideration rarely occurs only behind closed doors. Even if it happens there, the final outcome is still subject to careful scrutiny by traditional decision takers, by politicians, or recently, by the public, by the interest groups. More often, the procedure of planning, no matter whatever the form, entails negotiation. Negotiation basically forms an inevitable part of the process of planning, especially among contemporary accounts of planning.
Artificial neural network
“Cities are open and non-linear complex systems, mathematical equations have limitations in simulating such systems’’ According to Anthony Gar-on yeh and Xia Li (2003), artificial neural networks (ANN) have the capability of mapping nonlinear features. Artificial neural networks can be used to recognize and classify patterns through training or learning process. Studies indicate that neural networks provide levels of performance superior to those of conventional statistical models because neural networks can handle well the uncertainties of spatial data (Openshaw, 1993; Fischer and Gopal, 1994). ‘’Geographical analysis is usually based on incomplete and inconsistent data due to the complexity of nature. Classical quantitative methods cannot be used to solve complex spatial decision problems which are highly assumption-dependent and application-specific’’. Neural networks have been widely and seemingly extremely successfully applied in many disciplines that have a high degree of hardness.
Case study 1: Simulating urban encroachment on rural land using fuzzy controlled cellular automata in a geographical information system
In this case study, am going to compare results of two cases in which fuzzy logic was used in urban planning, and two cases where neural network was used, again I will present another instance where the two methods were combined together and then do my conclusion.
In the first case scenario taken from the journal article titled “Simulating urban encroachment on rural lands with fuzzy-logic controlled cellular automata in a GIS’’ by F. Wu (1997) , fuzzy logic was used in simulating urban encroachment on rural lands. The behaviour of feature conversion was captured by fuzzy logic, Cellular automata was used to in conjunction with Fuzzy logic to simulate global pattern from local rules and implemented in a geographical information system using ARC/INFO software. “ By providing a series of simulation scenarios, the study reveals potential hazardous consequences inherent in some development policy that would jeopardize sustainable development and demonstrates that the approach is a useful tool to provide decision support’’ F. Wu (1997) ‘’Local Government were required to zone high quality agricultural land in a compulsory protection zone to help protect valuable agricultural land, land development was carried out according to preference of individual project outside the zone’’. Site selection was largely a product of uncoordinated local decision making process. There was the need to identify the determinant of land conversion and simulation of development scenarios through microscopic models. Based on the study, some assumption of land development simulation was made. This model does not assume a fixed exogenous rate of land conversion, making it differ significantly from usual land allocation models that usually allocate development according to an assumed growth rate. ‘’Rather this model, this model treats the land simulation as a game, leaving the rate of land conversion to be determined by land competition. The aim of the study according to the author was to ‘’identify how different rules of development can lead to different spatial forms, urban development scenarios were produced through hypothetical yet possible policy alternatives’’.
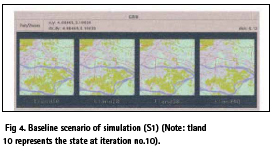
This model was applied to Guangzhou, a fast growing city in southern China. Due to its proximity to Hong Kong, the city has experienced growth as a result of manufacturing, housing development and a mix of inward investment. Encroachment on rural land was a major problem. ‘’Located in the Pearl River Delta, the metropolis has already been densely populated. The massive loss of quality agricultural land has jeopardized the sustainability of the region. The study focused on competition process which mainly involved three types of policy goals: urban development, preservation of cultivated land and preservation of orchards’’. The initial state of the land use for simulation was classified from a Landsat TM-5 image, processed with a supervised classification method using PCI, a remote sensing software.
Methodology
Analyses and discussion of result for case study one
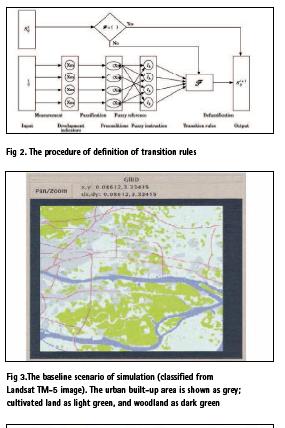
Figure (1) represents the procedures that defines the transition rules, the initial state of the land determines the instruction to be invoked. If no instruction is invoked, i.e., the set F is empty, the next state of the cell will be the same as its previous state. For multiple instruction, the development situation from the neighbourhood space is evaluated. Development situation is represented by indicators Xm which in this case is counted as the number of pixels belonging to different land uses. The next step is fuzzification which is to apply a predefined membership function to the actual values. The next stage is inference which is to deduce truth for firing an instruction. The final stage is, defuzzification is used to convert the set to crisp number, ie the discrete state of land use at the time t+1.”
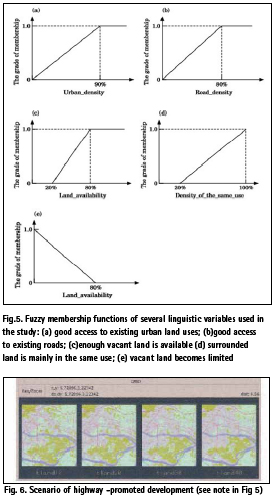
In the first case study, four simulations were run by iterating land development rules. The simulation was not based a specific time-scale, no imposition of projected conversion rate was made on the simulation. The first simulation, represent a baseline situation were membership function is applied (Figure 4). ‘’ The second simulation is a hypothetical policy alternative, which stresses the role of transport in urban growth, it assumes accessibility has a stronger effect on urban growth. The third and fourth simulation assumed that the control over cultivated and woodland would be relaxed. This is achieved through modification of membership function of uniformity and land availability of the baseline simulation. It can be said that the simulation exercise is hypothetical because the transition rate is not linked to some empirical phenomena.
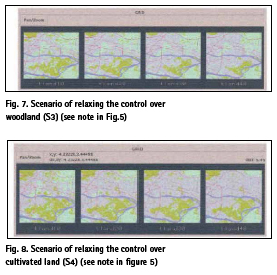
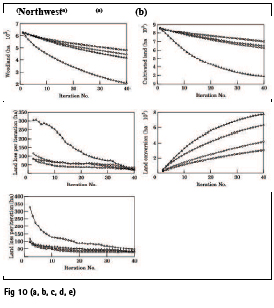
Figure 7 and 8 show the result of the third and fourth scenarios respectively. Relaxing control over woodland will lead to an increase in the growth rate of urban area, however relaxing control over cultivated land seemingly would lead to disastrous land encroachment. Figure 10(a) and (b) plot the decrease in cultivated and woodland. The interesting finding is that the loss of cultivated land and the loss of woodland are interrelated. The loss of one type of land would increase the risk of another type. For instance, encroachment on cultivated land will lead to increase in the development intensity of the area. Figure 10(c) and (d) suggest that land loses could occur very soon after relaxing control. Within the first 10 iterations, the land loss is obvious. The rate of land loss is decreasing over the simulation due to the increasing counteractive forces of preserving agricultural land. Figure 10(e) shows the accumulative land conversion from agricultural to nonagricultural uses. The fourth simulation clearly shows that a significant amount of land was converted in the study area.
Visualisation of land encroachment
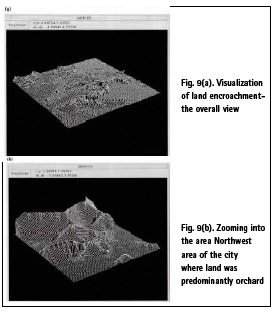
Figure 9(a) Show a three dimensional view of simulated land encroachment in the third scenario that is the assumption of relaxing control over woodland. Those areas where there is no land use change are displayed as a flat surface. Shaded in dark is the urban built-up area at the beginning of the simulation, while the light shaded area is agricultural land. The height represent the timing of the land encroachment, which is the iteration number during which the site experience land conversion. Therefore, the encroachment is visualized as a surface on which the most recent conversion is displayed as the highest ridge. From the zoom in clip (9b), it can be seen that most encroachment occur at the urban-rural fringes, penetrating along favourite land uses (in this case, woodland because the cultivated land is still under control) and squeezing underdeveloped agricultural land by surrounded urban land.
Case no: 2-Modelling ambiguity in urban planning using fuzzy logic
This case study is taken from a journal article titled Modelling ambiguity in urban planning.
Fuzzy membership function
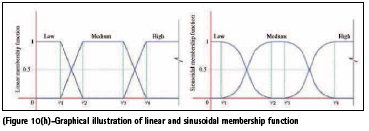
The membership function used to create the fuzzy sets are:- Linear membership function: Sinusoidal membership function:
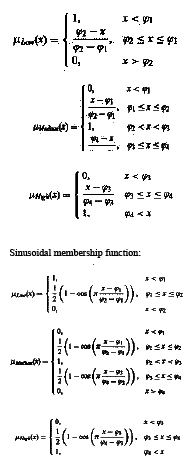
Where x is the input data; μlow(x), μMedium(x), μHigh(x) are membership functions defining the low, medium and high categories ø1, ø2, ø3 and ø4 are constant and they define critical values where membership function are shown in the figure 10
Results
Analyses and conclusion for case two
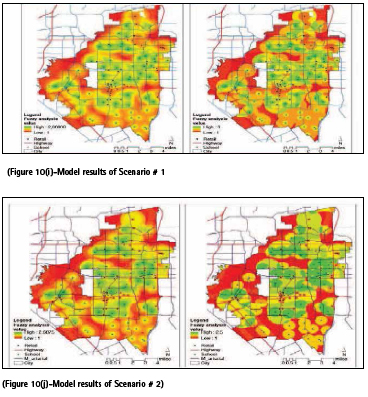
This result shows that fuzzy logic has advantage over Boolean logic in modelling ambiguity. This was known by comparing the suitability for residential development locations using data from the city of Arlington Texas. Factors that were considered are: – Suitability to different amenities like transportation facilities, retail centres, schools, activity centres, recreation centre etc. Three major factors were identified and taken out, they are: – Proximities to schools, retail centres and highways. Because the perception of proximity to the three types of facilities in terms of near or far varies by individuals, these data are ambiguous with no clear boundaries.
The results of scenario #1 and #2 are displayed in figure 10(i) and figure 10(j) respectively, visually when the two maps in each scenario were compared, the fuzzy logic model produces a more refined map with gradual transition of suitability rating than the Boolean logic model does.
Case study no: 3 Simulation of development alternatives using neural networks, cellular automata, and GIS for urban planning
The material for this case study is taken from an article written by Anthony Gar-On and Xia Li (2003) on the above subject. The study is an attempt to integrate neural network and cellular automata for development alternative. It is demonstrated in the paper that development alternatives can be simulated by incorporating planning objectives in cellular Automata.
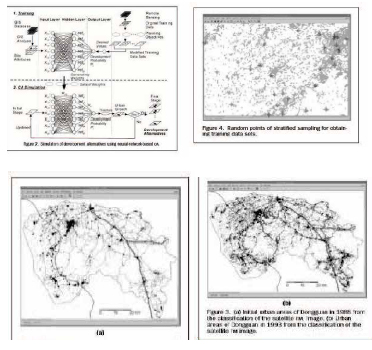
An artificial neural network is devised to estimate development probability based on the inputs of the sites attributes. Artificial neural network is good at handling complex relationship between site attributes and urban growth. According to Wu and Webster (1998), in conventional urban cellular models, development probability is central cell is usually estimated according to its neighbourhood conditions (attractiveness), such as developed quantity (density) and proximity variables. The proposed model consists of two separate parts— training and simulation (Figure 2). “The training is based on the back-propagation procedure which can generate optimal weights from a set of training data. Remote sensing and GIS data are used to provide the empirical data to reveal the relationships between site attributes and urban development.’’
Results and analyses
Analyses of result for case 3
The neural network was trained to obtain the parameter values so that the simulation can be executed. The training data were from the classification of the 1988 and 1993 satellite TM images. The classification provides the empirical information about urban development in the period (Figures 3a and 3b above under case studies 3). The classification results were imported to ARC/INFO GRID in grid format as training data. Although the original TM images had a ground resolution of 30 by 30 m, the cell size was reduced to 50 by 50 m by a resampling procedure for faster simulation. The total number of cells is 588 by 776. Data en- coding was carried out for the training data. The overlay of the two images reveals where urban development has taken place. The urban areas were 16,234.6 ha in 1988, but they in- creased to 41,087.9 ha in 1993 according to the classification of the satellite.
Conclusion
From the various case studies undertaken, it is observed that fuzzy logic is more suitable and effective when the boundary is not crisp. When the degree of uncertainty or ambiguity is high, fuzzy logic gives a better result than neural network. Fuzzy is particularly useful when handling imprecise and ambiguous data. Fuzzy logic proves to be very effective in clustering especially when each spatial unit has its own separate profile.
Neural network has been found to be a useful technique for regression and classification like problems like image classification. Neural network proves very useful particularly when the problem is highly non-linear. It is also good in handling mixture in data types. The strength of neural network is that they make no assumptions regarding the distribution of the data, it can be very effective when there is redundant data. Neural network is good and objective in assigning weight to different causative factors. The problem with neural network is that they operate like a black box in nature, again, relationship among neuron are quite complex and no way to determine best network structure.
Our recommendation is that a combination of the two methods (Fuzzy logic and Neural network would be the most effective depending on the situation that is to be applied. It is observe that the combination and integration of the two approach can provide a synthetic spatio-temporal methodology for the analysis, prediction and interpretation of urban growth and problem. Combining the both method where need be simply means that the two system will complement each other in the area where the other is not very effective.
References
Adhikari, B., & Li, J. (2013). Annals of GIS, 19(3), 143-152.
George, G, Panos, M, Yorgos N. P. (2012). Cities, 30, 193-203.
Maithani, S., Arora, M., K, & Jain, R., K. (2013). Geocarto International, 25(8), 663-681.
WU, F. (1998). Journal of Environmental Management, 53, 293-308.
Yeh, A., G. (2003). Photogrammetric Engineering & Remote Sensing, 69(9), 1043-1052.


 (3 votes, average: 3.67 out of 5)


Leave your response!