| Mapping | |
Water quality estimate in the Isahaya Bay with UAV
In this study, in the Isahaya bay, the correlation among water quality indexes was very high and water quality could be estimated at high accuracy |
 |
|
|
|
|
Water gates in the Isahaya bay were closed because of reclamation construction which started in 1989, and water conversion became a very serious problem. Then, the authors have carried out remote sensing research with a few centimeters of resolution and 6 bands. We took pictures by UAV and a camera on the ground with two infrared filters from May to August in 2016. The research had the following four processes. First process is acquiring picture data. The data of RGB was acquired by UAV directly, and we acquired the ocean temperature data from Japan Coast Guard. Second, we performed multivariable analysis. Multivariable analysis was applied for water quality in the Isahaya bay and picture data, and regression lines of water quality were obtained by calculating six bands. Third, using these regression water distributions were mapped by PhotoScan (three-dimensional structure software) each water quality. As a result, UAV was available for water quality estimate. Correlations among the water quality were very high. In this research, mapping water quality in the Isahaya bay was successful for environmental management using UAV. The advantage of mapping was visualization of numerical analysis for water quality.
Introduction
Recently, in the Isahaya bay, a critical problem with the worse environmental system occurred as well as rapid water conversion. After constructing the levee in the Isahaya bay, during winter, higher amount of solar radiation than usual and nutrient fl ow made red tide, then the color of laver seaweed became faded (Koibuchi, 2003), and the reclamation of the Isahaya bay made worse infections to the coastal environment and became a problem in the society. This is estimated that breaking down the periodic current made water quality worse by the construction of the levee in the Isahaya bay. However, preconstruction data in the Isahaya bay was so little. Some people of learning say there is the correlation between the construction of levee of the Isahaya bay and the water quality getting worse, others say there reveals no correlation (Tsukamoto and Yanagi, 2002, Odamaki et al., 2003, Nishinokubi et al., 2004, Komatsu et al., 2004, Tai et al., 2006). There is some correlation between fishery collapse in the Isahaya Bay and the Ariake Sea and construction of the levee. The Isahaya bay is damaged area on fishery. Especially, in summer in the Isahaya bay, dysoxic environment forms with density stratification in the low layer (Nakayama et al., 2004). Moreover, in summer of 2008, as current due to southwest wind occurred, blue tide occurred near the levee in the Isahaya Bay because of advective fl ow in the dysoxic water body (Tada et al., 2009). Also, in the north sea of the Isahaya bay, the density stratification was formed, and dysoxic water body occurred (Tada et al., 2008, Tai, 2015). Especially, on dry beach in Kama district, Konagai-cho, Isahaya, Nagasaki, cultivated Japanese littleneck died in large amount because of dysoxic environment (Fujii, 2003), and then, compressed air by the pump was injected (Hirano, 2010). In the Isahaya bay, 77% of dissolved oxygen supply for the low layer was estimated as vertical diffusion, while 23% was estimated as advective fl ow (Yamaguchi and Keizuka, 2006). Therefore, to clear the development mechanism for occurrence of dysoxic water body in the sea area, relationship between DO in the low layer, formation of the density stratification and fl ow characteristics was required. Also, application for water quality with UAV was carried out in the Isahaya bay (Otsubo et al., 2016). As above, remote sensing on water quality estimate in the Isahaya bay was still not enough. In this paper, 7 items of water quality were examined with high spatial resolution.
Materials and Methods
Study area
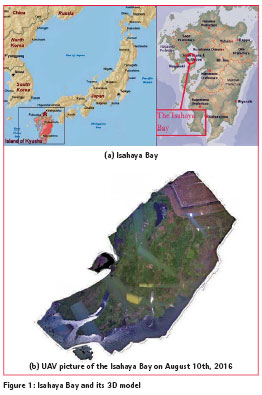
The Isahaya Bay is located in the Ariake Sea, Nagasaki prefecture, western Japan as shown in Figure 1 (a). The three-dimensional UAV picture of the Isahaya bay is shown in Figure 1 (b).
Data acquisition
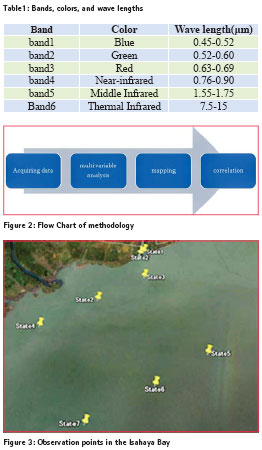
Remote sensing data in the research was obtained by UAV in the field and from the seawater temperature by Japan Coast Guard. Also, wa ter quality data were obtained from water examination. Table 1 shows six refl ection bands, colors, and wave lengths. Bands 1 to 5 were obtained by UAV and a digital camera on the ground, and band 6 was obtained from MODIS and a thermal camera.
Methodology
The data was made through four processes. First, the authors acquired RGB data by UAV in the field directly, and the ocean temperature data were acquired from Japan Coast Guard. Second, from obtaining water quality and acquiring water image data, multivariable analysis was applied to get water quality regression lines. Third, for mapping of water quality, the authors substituted water quality regression lines by multivariable analysis into PhotoScan. Finally, for correlation, the authors collected the data from water quality correlation.
Acquiring data
Photograph data
The authors performed the field study on May 7 and August 10 in 2016 in the Isahaya bay, using UAV (Phantom3 and Phantom4) to take photographs from the sky and a digital camera on the ground. Each photograph has GPS information: latitudes, longitudes, and altitudes. The authors were able to construct the three-dimensional form by PhotoScan. Also, the sea temperature data were acquired from MODIS.
Water quality
On May 7, 2016, water was sampled with GPS at 7 observation points as shown in Figure 3. Water quality index were chlorophyll-a, chlorophyll-fl u, conductivity, EC25, turbidity, DO, DO, water temperatures, and salt content.
Multivariable analysis
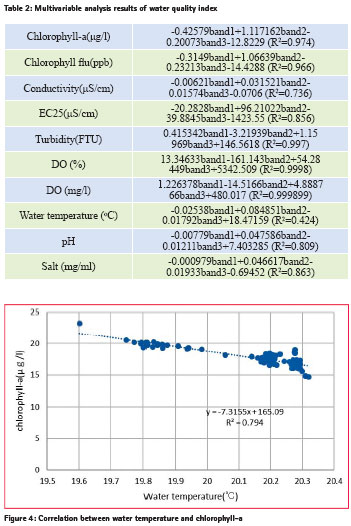
The multivariable analysis was applied for water quality data using bands1, 2, and 3 to get regression equations. Water quality was estimated by these equations, and then, the water quality indexes are shown in Table 2.
![]()
Mapping
Mapping of the water quality indexes was made from the expressions of multivariable analysis using PhotoScan, which estimates water quality from RGB with functions.
Correlation
The correlation among water quality indexes were calculated at the observation station1, and then the correlation became high or low.
Results and Discussion
Correlation
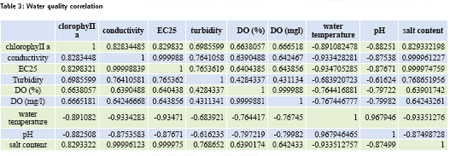
Table 3 shows the correlations among the water quality indexes. Chlorophyll-a and water temperature negatively correlated as shown in Figure 4. In the Isahaya bay two types of water body exist, river flow and the sea water. The former has low temperatures and high nutrient salts that relates with sewerage, while the latter has high temperature in summer and low nutrient salts. This mechanism suggests negative correlation between chlorophyll-a and water temperatures. Moreover, there is negatively-correlated between water temperature and DO, which suggests that water temperatures drive oxygen consumed. In Table 3, there are a lot of correlations among almost water quality indexes.
Mapping Data
Water quality index distributions are summarized in Figure 4. (a) is combined photos by UAV. (b) is salt content distribution, and it shows Hommyo river fl ows into the bay. Thus, the Isahaya bay was water conversion state. (c) is chlorophyll-a distribution. There were much Chlorophyll-a on the sea, while a little in the river. (d) is conductivity. Conductivity near the river was lower than the sea. Conductivity is almost proportion to salt content. (e) is turbidity distribution. Turbidity comes from mostly soils. (f) is pH distribution. pH depends on carbon dioxide, which relates chlorophyll-a.
Conclusions
Using the mapping data and correlations among water quality as well as multivariable analysis, the authors were able to study the water quality analysis. In this study, in the Isahaya bay, the correlation among water quality indexes was very high and water quality could be estimated at high accuracy. Therefore, water quality distribution could be obtained with high spatial resolution using UAV.
Acknowledgments
The authors appreciate Akihide Tada and Gaito Yamada greatly for technical assistance with the experiments.
References
A. Tada, Y. Nakamura, A.Tai, S. Suzuki, T. Nakamura, Infl uence of fresh water’s infl ow upon water quality dynamics in Isahaya Bay, Journal of JSCE, B2 (coastal engineering), 66, 1, pp.366-370, 2010.
S. Tsukamoto and T. Yanagi, Sea tide and periodic current in the Ariake Sea, the Sea and Sky, 79, 1, pp.31-38, 2002.
M. Odamaki, Y. Ooba, and N. Shibata, Historical observation results of tide current in the Ariake Sea, Marine Information Department Research Report, 39, pp.33-61, 2003.
E. Nishinokubi, T. Komatsu, S. Yano, and M. Saida, Infl uence estimate by the Isahaya reclamation project for fl owage structure in the Ariake Sea, Journal of Coastal Engineering, 51, pp.336-340, 2004.
T. Komatsu, S. Yano, M. Saida, and A. Tai, Study on change of tidal current and material transport in the Ariake Sea, Journal of Coastal Engineering, 53, pp. 326-330, 2006.
A. Tai, M. P. Hatta, S. Yano, M. Saida, and T. Komatsu, Infl uence of the levee for the sea tide and periodic current, Journal of Coastal Engineering,53, pp. 331-335, 2006.
T. Nakayama, S. Saeki, and K. Kimoto, Relationship of fl owage, structure of bedding and DO on low layer in the Isahaya Bay in Summer, Journal of Coastal Engineering, 51, 906-910, 2004. A. Tai, T. Ohba, Y. Hayami, T. Komatsu, S. Yano, and
A. Tada, Study on fl ow characteristics in the Isahaya Sea based on field observations, Journal of JSCE, B2 (coastal engineering), 71, pp.433-438, 2015.
K. Hirano, J. Higano, H. Nakata, A. Shinagawa, T. Fujita, M. Tokuoka, K. Kogo, An experiment for preventing mass mortality of cultured shortneck clams due to hypoxia formation during summer in Isahaya Bay, Fishery Engineering, 47(1) pp.53-62, 2010.
S. Yamaguchi and Y. Keizuka, Generation mechanism of hypoxia in Isahaya Bay, Journal of Oceanography, 15(1) pp.37-51, 2006.
S. Kim, A. Tada, A. Tai, K. Yaoyama, and S. Suzuki, Behavior of fresh water in the northern part of Isahaya Bay during summer season in 2013, Journal of JSCE, B1 (Hydroengineering), pp. 667-672, 2015.
S. Otsubo, S. Ogawa, H. Hidaka, and G. Yamada, Present state of UAV and applications for civil engineering, NAOSITE, 46, 87, 2016.
S. Hosaka, K. Iwashita, and T. Ooki, Relationship of chlorophyll-a and water quality index, 42, 2, 2009.
The paper was presented at Asian Conference on Remote Sensing (ACRS), Colombo, Sri Lank, 17-21 October, 2016


 (2 votes, average: 3.50 out of 5)


Leave your response!