| Mapping | |
Smart Counting – Oil Palm tree inventory with UAV
This article demonstrates an effi cient way of taking stock of oil palm tree stands at the comfort of the owner without the usual several days of hard labour |
 |
|
 |
|
 |
|
 |
|
Unmanned Aerial Vehicle (UAV) System has gained popularity in the field of photogrammetry, remote sensing and geospatial engineering for civilian applications. Its impact on society and the speed of project delivery has undeniably presents users with varieties of choice and producers with very attractive competitiveness. Business leaders and geospatial users are increasingly faced with the challenge of how to incorporate various UAV technology preferences in their projects. Currently, UAV is the fastest means of collecting high quality image and generating DEM of sizeable project area. Satellite remote sensing has been widely used for collecting data over large areas for vegetation and agricultural applications, particularly for plantation monitoring [1]. But for small to medium scale enterprises, the use of space and airborne platforms are not economical due to budget constraint.
In recent times, UAVs are being deployed for many remote sensing applications. Depending on the type and mission of the UAV, it can be flown at different altitudes and at any time. This flexibility allows for optimization of the operations according to weather conditions over a given area and the user requirements. High spatial resolution and speed of delivery makes application of data acquired with UAV becoming popular in environmental remote sensing such as cadastral mapping [2], post-flood analysis [3], [4], vegetation cover assessment [5], crop monitoring [6], forest fire [7], traffic monitoring [8]–[15] etc.
In Malaysia, Oil palm is one of the main economic crop and the larger percentage of the plantations are owned by private individuals categorised as small scale farmers. One of the common activities is taking stock of the number of palm trees within the plantation. This information is vital for estimating yield and productivity. Conventionally, inventorying is achieved by either manually counting oil palm tree crowns on imageries or ground surveying using GPS to gather their locations information. Obviously, it is impossible to obtain accurate inventorying with these methods in large oil palm plantation. Besides, the traditional process of counting is prone to erroneous estimation, expensive and time consuming.
UAV-based palm tree inventory
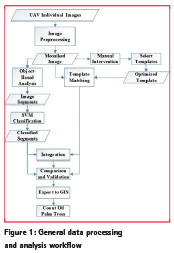
High spatial resolution images captured with UAV offers a reliable prospect to detect palm trees with a characteristic crown formation. Template matching algorithms is a popular technique for detecting object from image using the object’s boundary as a criteria [16]. In some cases, however, the use of boundary could be misleading due to image distortion or occlusion [17]. Furthermore, template matching can be affected by the geometry and scale of the object in the image. To overcome these limitations, object-based analysis was applied where the boundary of objects are defined through segmentation. Selection of segmentation parameters that are suitable for varying geometry and scale of trees can result to accurate detection. For these reason, template matching and object-based image analysis were integrated into a single processing workflow (Figure 1) to improve the counting accuracy and the result was compared with another experiment produced with template matching only.
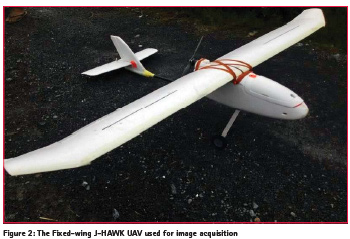
With Canon S100 (12-mega pixels) mounted, a fixed-wing J-HAWK UAV (Figure 2) was flown over the Melaka Pindah oil palm plantation, Peninsula Malaysia, for data collection. Following data collection, individual UAV image was visually evaluated and only the high quality images with minimum noise and blurring were retained. Subsequently, the images were matched in Agisoft Photoscan [18] using ground control points acquired with GPS for the registration process. The registered images were mosaicked to generate panoramic image from which the study area was subset for this study.
Theoretical bases
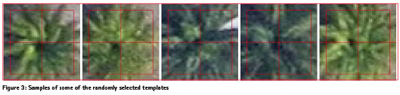
Template matching has been used in computer vision for object recognition [19]. The algorithm searches the image to find an area within a larger image that matches a specific and smaller template image (i.e. a sub-image of that larger image). Basically, it is a measure of the similarity between the image and the feature [20]. One way to perform template matching is to calculate the cross correlation between the template and the images, compared using the squared Euclidean distance (Equation 1 – 3). The algorithm compares a template that contains the shape we attempt to find (i.e. oil palm tree crown (Figure 3)) to an image.

Object-based image analysis (OBIA) is the tool of the era among remote sensing professionals for extracting useful information from an image. Compared to the pixel-based methods, OBIA considers spectral information from a set of similar pixels believed to belong to the same object. The basic element of OBIA is segmentation which partitions an image into unclassified segments or image objects based on a measure of spectral properties that include colour, size, texture, shape and contextual information [21]. Specifically, the quality of segmentations and the resulting object primitives are based on colour, shape, size and pixel neighbourhood influenced by parameters set by the user. As a rule, a user needs to define the scale and colour/shape parameters. The value of the scale parameter determines the size of the image object. Large scale value allows high variability within each object which ultimately results in relatively large segments being created [21]–[23]. On the contrary, small scale value permits less variability and, therefore, creates smaller segments. Like the scale criteria, colour and shape parameters also affect how segments are created. Higher value for colour/shape criteria optimizes spectral and spatial homogeneity. Within the shape criterion, the degree of smoothness of object border and compactness of the segments are two important parameters that must be defined along with scale parameter.
Experimental result
First, the UAV subset image was visually examined and several templates were selected. The templates were tested to predict possible presence of other trees and thereafter the optimized template was selected. Once this was done, the optimized template was passed through template matching process to generate correlation image. Each pixel in the generated image demonstrates the correlation factor between the template and the image. Further processing was carried out to generate a thematic layer representing the palm tree crown where centroid point was produce to represent each tree stand in the image. Note that the points were generated by using a correlation threshold. For example, if a threshold of (0.7) is selected, then all pixels in the correlation image are converted into points while those not meeting the threshold are regarded not to be palm trees. To appropriately select this threshold, a sensitivity analysis is required; so, several thresholds were examined and the best threshold based on the prediction capability was selected. In addition, the image was further analyzed to create image objects using multi-resolution segmentation, an object-based image analysis technique (explained earlier). Using the spectral and spatial attributes of the segmented image objects, two classes, oil palm trees and background, were defined. Subsequently, the oil palm trees class was integrated with the result of the template matching which produced improved result. Finally, the results were exported into GIS to automatically count the number of oil palm trees in the image. Thereafter, the performance of the two approaches (template matching and integrated template matching-object-based) was evaluated using manually selected samples.
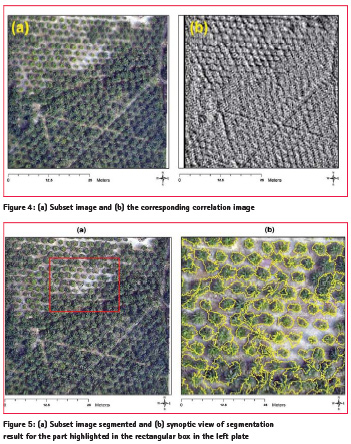
Several templates were identified in the original image and stored in a database. These templates were classified into three classes, oil palm tree, error, undefined based on visual investigation. In order to select the vtemplate with the best image quality, the templates were analysed and the accuracy of counting determined for each template using the correlation coefficient (R2). The template with the highest R2 was selected as the best. Based on the optimum template, the correlation image was constructed. Each pixel value in the correlation image represents the correlation coefficient between the template image and the original image. Correlation image is represented in shade of grey scale where high correlation is represented as bright (white colour) whereas the dark pixels represent low correlation values. From Figure 4, it can be seen that the oil palm trees are shown as bright colour in the corresponding correlation image (Figure 4b). This indicates that the template matching algorithm detected the location of oil palm trees. For the purpose of counting, correlation value greater than the threshold (T) were converted into points (vector format). The threshold (T) of 0.65 was selected using trial and error approach to generate the point representation of the oil palm trees in the image.
Object-based analysis generated image objects, a non-overlapping homogeneous regions from the subset image (Figure 5a) based on the defined segmentation parameters values 85, 0.4, and 0.5, for the scale, shape and compactness respectively (Figure 5b). From the image objects, 20 training samples comprising of 10 oil palm trees and 10 background samples were randomly selected for the classification using Support Vector Machine (SVM) classifier. SVM was selected because of its relative simplicity and the well-published quality of classification performance in literature [24]. Even though the quality of image segmentation is good, the challenges identified include two or more image objects merging into one segment (oversegmentation) while at times individual trees crowns are represented by two or more segments (under-segmentation). Again, due to the viewing angle relative to the sun position, shadow areas are considered as tree crowns and segmented as such too. These issues degraded the quality of object-based method making it difficult to solely rely on it for counting. This makes integrating the two methods a feasible solution.
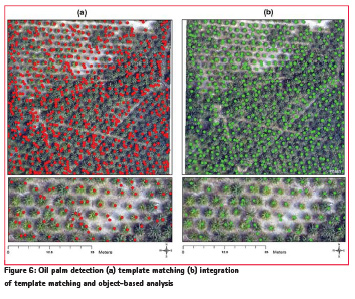
The outcome of the two approaches are represented in point form for ease of counting (Figure 6). It can be seen that most of the trees were detected accurately, however, the main challenge is that some trees were counted twice or more especially, in dense areas (6a). In areas where palm trees are separated, the template matching algorithm works well. But in the denser part, error occurred such as those highlighted in the north part of the study area. A clearer perspective of this phenomenon is amplified in the north part of the study area in the image at the bottom.
On the other hand, the result obtained by combing the two methods yielded better detection. It significantly reduced the error observed in the template matching method as presented in the bottom plate of Figure 6b. Where a single palm tree crown is represented by more than a point in the template matching method, the second technique corrects the error by identifying it with single dot. However, where two or more tree crowns are knitted, the integrated approach have some limitations in deciding how many they are, and therefore leave it blank. Nonetheless, the integrated approach performs better than the template matching, and this is further elaborated in the quantitative evaluation.
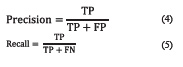
Comparison with the ground truth data offers quantitative metric to evaluate the performance metrics using precision, recall and the F-measure [1], [25], [26] expressed in Equation 4 – 6.
![]()
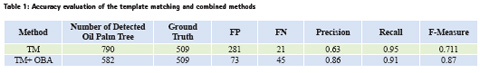
where a True Positive (TP) is the number of correctly detected oil palm. A False Negative (FN) is an oil palm tree that is not detected. A False Positive (FP) shows a pixel that is recognized as an oil palm tree but it is something else. α is a non-negative scalar. In this study, is set to 0.5 as suggested in [25]. In this context, precision can be interpreted as the probability that a detected oil palm tree is valid and recall is the probability that the correct oil palm tree (ground truth) is detected. The F-measure defines the (weighted) harmonic mean between precision and recall, where the precision and recall are combined into a single performance measure. As a consequence, it measures the overall performance metric with 87% accuracy compared to 71% in template matching (Table 1). The detection precision follows similar trend.
Summary
Advances in space science and computing have largely improved farming methods, productivity and yield. This article demonstrates an efficient way of taking stock of oil palm tree stands at the comfort of the owner without the usual several days of hard labour. The approach employed significantly minimizes error in counting compared to using the widely employed template matching (a meticulous manual counting check confirmed this). Reduction in error of estimation from of 790 tree stands 582 (i.e. about 27%) is a great improvement to effective decision making process, allocation of resources and quantitative yield estimation. Automation of this process into a computer-based program simplified for non-technical users will be a vital tool not only to the farmers but policy makers and relevant government agencies in making informed decision.
References
[1] P. Srestasathiern and P. Rakwatin, “Oil palm tree detection with high resolution multi-spectral satellite imagery,” Remote Sens., vol. 6, no. 10, pp. 9749–9774, 2014.
[2] M. Manyoky, P. Theiler, D. Steudler, and H. Eisenbeiss, “Unmanned Aerial Vehicle in Cadastral Applications,” ISPRS – Int. Arch. Photogramm. Remote Sens. Spat. Inf. Sci., vol. XXXVIII-1/, pp. 57–62, 2012.
[3] A. Rango, A. Laliberte, J. E. Herrick, C. Winters, K. Havstad, C. Steele, and D. Browning, “Unmanned aerial vehicle-based remote sensing for rangeland assessment, monitoring, and management,” J. Appl. Remote Sens., vol. 3, no. 1, pp. 1–15, 2009.
[4] A. Hervouet, R. Dunford, H. Piégay, B. Belletti, and M.-L. Trémélo, “Analysis of Post-flood Recruitment Patterns in Braided-Channel Rivers at Multiple Scales Based on an Image Series Collected by Unmanned Aerial Vehicles, Ultra-light Aerial Vehicles, and Satellites,” GIScience Remote Sens., vol. 48, no. 1, pp. 50–73, 2011.
[5] R. P. Breckenridge, J. L. Harbour, and R. D. Lee, “Using Unmanned Aerial Vehicles to Assess Vegetative Cover and Identify Biotic Resources in Sagebrush Steppe Ecosystems : Preliminary Evaluation,” 2006.
[6] A. M. Jensen, “cooperative remote sensing for real-time water management and distributed irrigation control Band-reconfigurable Multi- UAV-based,” no. January 2016, 2008.
[7] V. G. Ambrosia, S. S. Wegener, D. V. Sullivan, S. W. Buechel, S. E. Dunagan, J. a. Brass, J. Stoneburner, and S. M. Schoenung, “Demonstrating UAV-Acquired Real- Time Thermal Data over Fires,” Photogramm. Eng. Remote Sens., vol. 69, no. 4, pp. 391–402, 2003.
[8] J. Xiao and F. Han, “Vehicle Detection and Tracking in Wide Field-of-View Aerial Video,” pp. 679–684, 2010.
[9] C. Huang, Y. Wu, and J. Kao, “A Hybrid Moving Object Detection Method for Aerial,” pp. 357–368, 2010.
[10] X. Cao, Z. Shi, P. Yan, and X. Li, “Tracking vehicles as groups in airborne videos,” Neurocomputing, vol. 99, pp. 38–45, 2013.
[11] Z. Zheng and G. Zhou, “Institute of Geo-Spatial Information Technology , University of Electronic Science and Technology of Guangxi Key Laboratory for Spatial Information and Geomatics, 12 Jian Gan Road , Guilin , Guangxi , College of Resource and Environment , Chengdu Univers,” Igarss, pp. 5997–6000, 2012.
[12] Y. Yang, F. Liu, I. Member, P. Wang, P. Luo, and X. Liu, “Vehicle detection methods from an unmanned aerial vehicle platform *,” pp. 411–415, 2012.
[13] A. G. A. Perera, C. Srinivas, A. Hoogs, G. Brooksby, and Wensheng Hu, “Multi-Object Tracking Through Simultaneous Long Occlusions and Split-Merge Conditions,” 2006 IEEE Comput. Soc. Conf. Comput. Vis. Pattern Recognit. – Vol. 1, vol. 1, pp. 666–673, 2006.
[14] F. Heintz, P. Rudol, and P. Doherty, “From images to traffic behavior – A UAV tracking and monitoring application,” FUSION 2007 – 2007 10th Int. Conf. Inf. Fusion, pp. 1–8, 2007.
[15] A. Puri, K. P. Valavanis, and M. Kontitsis, “Statistical profile generation for traffic monitoring using real-time UAV based video data.”
[16] Z. Yang, “Fast template matching based on normalized cross correlation with centroid bounding,” 2010 Int. Conf. Meas. Technol. Mechatronics Autom. ICMTMA 2010, vol. 2, no. 1, pp. 224–227, 2010.
[17] I. a Aljarrah and A. S. Ghorab, “Object Recognition System using Template Matching Based on Signature and Principal Component Analysis,” Int. J. Digit. Inf. Wirel. Commun., vol. 2, no. 2, pp. 156–163, 2012.
[18] Agisoft Photoscan, “Agisoft Photoscan User Manual – Optimisation,” Version 1.2.3, 2015.
[19] K. Ahuja and P. Tuli, “Object Recognition by Template Matching Using Correlations and Phase Angle Method,” Int. J. Adv. Res. …, vol. 2, no. 3, pp. 1368–1373, 2013.
[20] J. P. Lewis, “Fast Template Matching Template Matching by Cross Correlation 2 Normalized Cross Correlation Normalized Cross Correlation in the Transform Domain,” Pattern Recognit., vol. 10, no. 11, pp. 120–123, 1995.
[21] T. Blaschke, B. Feizizadeh, and H. Daniel, “Object-Based Image Analysis and Digital Terrain Analysis for Locating Landslides in the Urmia Lake Basin, Iran,” IEEE J. Sel. Top. Appl. Earth Obs. Remote Sens., vol. 7, no. 12, pp. 1–12, 2014.
[22] Y. Gao, N. Kerle, J. Mas, A. Navarrete, and I. Niemeyer, “Optimized image segmentation and its effect on classification accuracy,” Int. J. Remote Sens., vol. 32, no. 13, pp. 3747–3763, 2011.
[23] T. Lahousse, K. T. Chang, and Y. H. Lin, “Landslide mapping with multi-scale object-based image analysis-a case study in the Baichi watershed, Taiwan,” Nat. Hazards Earth Syst. Sci., vol. 11, no. 10, pp. 2715–2726, 2011.
[24] L. Zhang, F. Lin, and B. Zhang, “Support vector machine learning for image retrieval,” Image Process. 2001. Proceedings. 2001 Int. Conf., vol. 2, no. x, pp. 721–724 vol.2, 2001.
[25] T. Liu, Z. Yuan, J. Sun, J. Wang, N. Zheng, X. Tang, and H.-Y. Shum, “Learning to detect a salient object,” Comput. Vis. Pattern Recognit., vol. 33, no. 2, pp. 1–8, 2011.
[26] P. L. Rosin, “A simple method for detecting salient regions,” Pattern Recognit., vol. 42, no. 11, pp. 2363–2371, 2009.


 (No Ratings Yet)


Leave your response!