| Applications | |
Review of Normalized Difference Vegetation Index (NDVI) as an Indicator of Drought
The present study attempts to review the satellite based Normalized Difference Vegetation Index (NDVI) as an indicator of drought and provide insight into the findings from various research studies that have used NDVI for drought monitoring, detection and assessment |
 |
|
In remote sensing technology, vegetation indices are considered as a single number that quantifies vegetation biomass for each individual pixel in a remote sensing image. It is basically computed from the spectral bands that are sensitive to biomass and vigor. In other words, they are mathematical transformations usually ratios or linear combinations of reflectance measurements in different spectral bands lying within the visible and near infrared bands (Payero et al., 2003). These indices are used to extract information related to surface characteristics by understanding the spectral differences in the reflectance patterns between green vegetation and other surfaces. Through the years, a number of vegetation indices have been evolved with simple to the most complex band combinations (Perry and Lautenschlager, 1984; Bannari et al. 1995; Payero et al., 2003). Tucker et al. (1979) found that the red (RED) radiance measured above corn and soybean crops decreased as the season progressed, due to increased chlorophyll absorption by increased leaf area index (LAI). The photographic infrared (NIR) radiance, on the other hand, increased with time and LAI. They used five linear combinations of the red and infrared radiance data as radiance normalization techniques to compensate for this variability (Payero et al., 2003). These transformations were later called vegetation indices that includes the Band Ratio (RATIO), Band Difference (DVI), Band Sum (SUM), the Vegetation Index (VI), and the Transformed Vegetation Index (TVI). They found the RATIO, the VI, and the TVI to be the most useful normalization techniques, with preference for the VI. The VI was later called the Normalized Difference Vegetation Index (NDVI) which have become the most widely used vegetation index today. It has been extensively used for assessing and monitoring vegetation dynamics, biomass production, changes in vegetation conditions, soil moisture stress (droughts), carbon sequestration and many more.
However, it is observed that drought monitoring is always a challenge as it is a slow onset natural disaster developing over months and years. The severity of drought also varies depending on precipitation deficit, spatial extent and duration making it difficult to compare one drought with another (Peters et al., 2002). While NDVI has proven useful for timely estimation of vegetation condition, however, it does not allow for relative comparison at a pixel location or time period (Burgan and Hartford, 1993; Kogan, 1995; Peters et al., 2002). NDVI data has been extensively used for more than a decade in classifying vegetation condition. Kogan (1990), suggested an approach to vegetation condition monitoring based on minimum and maximum NDVI values compiled per pixel over time (Peters et al., 2002). Kogan (1990) states that available moisture and natural resources determine the NDVI minimum while other values, including the historical maximum are determined by the weather (Peters et al., 2002). This NDVI statistical range was then used to develop the Vegetation Condition Index (VCI) which is an indicator of environmental stress. The VCI is NDVI normalized for each pixel on the basis of maximum statistical range over the historical record of available satellite imagery (Peters et al., 2002). With the NDVI playing an important role for agricultural drought monitoring, it is amply felt that a review of NDVI would help provide more insight into how NDVI can be used as an indicator of drought.
Potentiality of Satellite Based NDVI for Drought Monitoring
Development of remotely sensed vegetation indices have been an ongoing process. The basic assumption behind developing such indices is that some algebraic combination of remotely sensed spectral bands can reveal valuable information such as vegetation structure, state of vegetation cover, photosynthetic capacity, leaf density and distribution, water content in leaves, mineral deficiencies and evidence of parasitic shocks or attacks (Yengoh, et al., 2014; Jensen 2007; Liang 2005). The algebraic combinations of these spectral bands needs to be sensitive to one or more of these factors.
NDVI is a numerical indicator that uses the visible and near-infrared bands of the electromagnetic spectrum. It is adopted to analyze remote sensing measurements and assess the greenness in the vegetation cover. NDVI has found a wide application in vegetative studies as it has been used to estimate crop yields, pasture performance, and rangeland carrying capacities among others. It is often directly related to other ground parameters such as percent of ground cover, photosynthetic activity of the plant, surface water, leaf area index and the amount of biomass. NDVI was first used in 1973 by Rouse et al. from the Remote Sensing Centre of Texas A&M University.
The NDVI, (Equation 1) is the ratio of the difference between the near-infrared band (NIR) and the red band (R) and the sum of these two bands (Rouse Jr. et al., 1974).
![]()
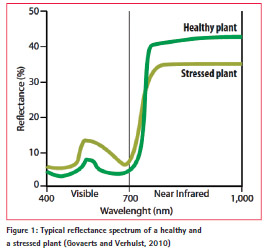
where NIR is reflectance in the nearinfrared band and RED is reflectance in the visible red band. The NDVI algorithm takes advantage of the fact that green vegetation reflects less visible light and more NIR, while sparse or less green vegetation reflects a greater portion of the visible and less Near-IR. NDVI combines these reflectance characteristics in a ratio so it is an index related to photosynthetic capacity. The range of values obtained is between −1 and +1. Only positive values correspond to vegetated zones; the higher the index, the greater the chlorophyll content of the target (Yengoh, et al., 2014). The use of NDVI is more robust than other indices as many sensors from handheld to satellite provide measurements in the near infrared and the red portion of the electromagnetic spectrum and this holds true as almost all satellites have NIR and RED bands. NDVI has already been extensively used in assessing crop nutrient deficiency, long term water stress, and yield decline in crops (Figure 1).
In terms of drought monitoring, NDVI derived from satellite data can be used to indicate deficiencies in rainfall and assess meteorological and agricultural drought patterns both timely and spatially. Since drought is a slow-onset disaster, therefore, its consequences are immeasurable. NDVI derived from Advanced Very High Resolution Radiometer (NOAA-AVHRR), can calculate the status of vegetation whether healthy, unhealthy or sparse (example: suffering from drought or pest infestations) (Zargar et al., 2011). While NDVI derived from NOAA-AVHRR resolution is high (1 km), it can still cover large areas (Ji and Peters, 2003). Current NDVI algorithms can reduce noise from atmospheric conditions such as clouds and effects of the sun-surface geometry with respect to the sensor. It hence broadly distinguishes vegetated areas from other surfaces. It can measure dryness rather than interpolation or extrapolation (Zargar et al., 2011).
The U.S. Geological Survey’s (USGS) Earth Resources Observation and Science (EROS) Center is generating one product called “eMODIS” (U.S. Geological Survey, 2012) based on Moderate Resolution Imaging Spectroradiometer (MODIS) data acquired by the National Aeronautics and Space Administration’s (NASA) Earth Observing System (EOS) (Sruthi and Aslam, 2015). The eMODIS NDVI are global datasets at 250 m spatial resolution and available in GEOTIFF format. Using the NDVI data, the changes in vegetation cover in an area along with the trend in occurrence of agricultural drought can be studied (Sruthi and Aslam, 2014). Their study concluded that NDVI due to its simple calculation is largely used for vegetation studies at the regional and global scale. However, it is always advised to combine NDVI along with other parameters to get better results.
Researchers at the National Drought Mitigation Center (NDMC), University of Nebraska-Lincoln has been extensively working on drought monitoring in the United States and they have found that remote sensing has proven to be a useful tool for large vegetation monitoring given the synoptic coverage, high temporal repeat cycle and continuous, moderate resolution observations of satellite based sensors. Researchers at NDMC stated that analysis of time-series NDVI data and NDVI-derived metrics have been an effective means for identifying vegetation condition anomalies such as apparent declines in vegetation health. NDMC has come up with a new drought monitoring tool called the Vegetation Drought Response Index (VegDRI) that integrates satellite based NDVI observations, climate-based drought index data, and several biophysical characteristics of the environment to produce an indicator that expresses the level of drought stress on vegetation. The VegDRI uses concepts from remotely sensed NDVI and climate based drought index approaches to produce 1 km resolution maps that characterizes the intensity and spatial patterns of drought induced vegetation stress over large areas. The NDVI maps at 1 km resolution provides information on spatial patterns of vegetation which are analyzed by combining dryness information from climate based drought index data to provide the intensity and spatial extent of drought conditions. VegDRI was developed through a collaborative research between the National Drought Mitigation Center (NDMC) and USGS Earth Resources Observation and Science (EROS) Center and its aim is to provide near-real time information as a national drought monitoring tool for United States. The index uses eMODIS NDVI composites while climate-based drought data include the Palmer Drought Severity Index (PDSI) and weekly Standardized Precipitation Index (SPI) data from the High Plains Regional Climate Center (HPRCC).
Further studies have shown that NDVI has been a good indicator of drought. Studies conducted by Owrangi et al., 2011 put forward a fast, efficient and reliable method for producing drought maps from NOAA-AVHRR and comparing it with SPOT vegetation maps which confirms that SPOT vegetation maps can be used as a reliable substitutes for any missing or cloudy NOAA-AVHRR data. The Drought Severity Index (DSI) maps derived from NDVI maps showed reasonable vegetation cover during the years which confirms rational yields. Singh et al. (2003) used NDVI, Vegetation Condition Index (VCI) and Temperature Condition Index (TCI) to monitor droughts as well as estimate vegetation health. In their research, they used both vegetation and temperature condition indices to monitor droughts in India. The NDVI derived from NOAAAVHRR has been extensively used in vegetation monitoring, crop yield forecasting and drought detection and mapping. The ability to use AVHRR data for drought detection and mapping is based on the higher reflectance generated from moisture stressed vegetation (Unganai and kogan, 1998). According to their research, it is found that NDVI has two characteristics that make it ideal for vegetation monitoring one being that no other surface exhibits higher NDVI values than vegetated surfaces and the second being when vegetation vigor changes due to the nature of the vegetation growth and development cycle or environment induced stress such as drought, that makes the NDVI to change. This gives NDVI its potential for drought detection and mapping as well as climate impact assessment (Unganai and kogan, 1998). Studies conducted to evaluate NDVI and Normalized Difference Water Index (NDWI) for vegetation drought monitoring suggest that continued evaluation of NDVI and NDWI for vegetation drought monitoring using ground observations is crucial to better understand how these indices respond to soil moisture fluctuations leading to drought stress on plants (Gu et al., 2008). Results from the study showed that NDVI and NDWI were found to have comparable sensitivities to soil moisture fluctuations as expressed by Fractional Water Index (FWI) and that both can be used for vegetation drought monitoring. It also further showed that relationship between satellite-derived vegetation indices and soil moisture is highly dependent on the land cover heterogeneity and soil type while in case of homogeneous vegetation cover, both NDVI and NDWI were sensitive to changes in soil moisture which are strongly related to vegetation drought conditions. NDVI and NDWI both exhibited similar relationships with FWI variations, suggesting that both indices are appropriate for monitoring drought stress on vegetation.
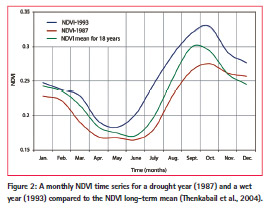
Thenkabail et al., 2004 also investigated the historical pattern of droughts in the Southwest Asia using monthly time series NOAA-AVHRR data for 1982-1999. They developed the regression relationships between the drought-related indices obtained from MODIS and NOAA-AVHRR data having different pixel resolution and optical characteristics. This has resulted in the development of a MODIS-AVHRR based drought reporting system. The goal is to make the system available via internet to all stakeholders in the region that includes government agencies, NGO’s, research institutions and global research community. The system can be used both as a drought monitoring and decision support tool in regional drought assessment and management. The NDVI data was used to understand the severity of a drought on the basis of its extent of wetness. It was also observed that the departure from the long term mean NDVI is effectively more than just a drought indicator as it also reflects vegetation conditions based on normal and wet months per year. The historical drought interpretation carried out further suggest that the extent of negative deviation of NDVI from its long term mean for a pixel, district or region and the duration of continuous negative deviations are the powerful indicators of the drought magnitude and persistence. Figure 2 shows the long term normal NDVI conditions and relative to it, the driest (1987) and the wettest (1993) years NDVI value for each month for the targeted study area (Thenkabail et al., 2004).
Sharma, 2006 used spatial data mining techniques for drought monitoring in the Karnataka state of India. The study used rainfall data from 1970-2004 to compute Standardized Precipitation Index (SPI) and NOAA-AVHRR NDVI for the period 1981-2003 to calculate Vegetation Condition Index (VCI). The study concluded that NOAA-AVHRR NDVI data has been widely used for drought monitoring and detection effectively and efficiently. NDVI times-series data was used to calculate Vegetation Condition Index (VCI) to estimate the vegetation health and monitor drought. SPI derived drought values were compared with that of VCI for effective drought monitoring. This led to the conclusion that integration and analysis of drought identified areas from SPI and VCI can help in correctly identifying the region affected by drought. The study also observed that rainfall/ SPI and NDVI generally have positive correlations in the study area while data mining technique through association rule was possible to extract the temporal and spatial pattern of drought from 1993- 2003 by identifying the relations between climatological and meteorological data.
Scientist from the National Aeronautics and Space Administration (NASA), calculated average NDVI values for an area to find out what is normal at a particular time of year as NDVI images can measure drought when compared to normal plant health. This data was measured by the vegetation instrument on Europe’s SPOT satellite provided by Digital Globe/SPOT, under the agreement with the U.S. Department of Agriculture Foreign Agricultural Service (USDA/FAS). According to NASA, a region’s absorption and reflection of photosynthetically active radiation over a given time period can be used to characterize the health of the vegetation, relative to the norm (NASA Earth Observatory). Therefore, all these information shows the coherency of NDVI during drought period and its potential to serve as an important indicator of drought.
Application of NDVI for Drought Early Warning: A Famine Early Warning System Network (FEWS NET) of East Africa
Generally, vegetation shows a lagged response to drought because of the delayed vegetation response to developing rainfall deficits due to residual moisture stored in the soil (Thenkabail et al., 2004; Senay et al., 2015). Studies have revealed that vegetation response to water stress occurs in two phases: first, the vegetation responds to the initial short-term/temporary depletion of precipitation/soil moisture through plant water conserving mechanisms that would reduce plant water loss (mostly by transpiration) by the closure of stomata (Maselli et al., 2009; Senay et al., 2015) which does not show any external signs of stress as plant biomass is not reduced. However, if there is an extended period of precipitation deficit, it results in reduced photosynthesis leading to reduction in vegetation condition (Maselli et al., 2009; Senay et al., 2015). Such vegetation conditions (drought impact) can be monitored by satellite data through the use of various indices.
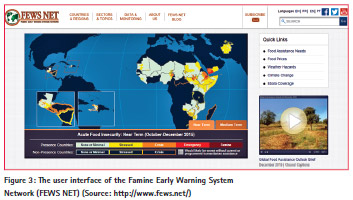
The Famine Early Warning System Network (FEWS NET) developed by Senay et al., 2015, uses maximum value composites of NDVI (Figure 3). FEWS NET uses NDVI generated from MODIS known as eMODIS and respond to the operational land monitoring applications that requires near real time NDVI data to compare with the historical data. A time series smoothing technique developed by Swets et al., 1999 was used to smooth the NDVI composites (Senay et al., 2015). The smooth time series was used to derive a 10 year mean NDVI on a pixelby- pixel basis for a 72 composite period considered per year. This is followed by deriving the NDVI deviations from the 10 year dekadal average and the previous dekads produced for each period. The NDVI anomaly isoloates the variability in the vegetation signal and establishes the historical context for the present NDVI to determine relative drought severity (Anyamba and Tucker, 2012; Senay et al., 2015). The NDVI anomaly, also has the ability to identify any negative anomaly over large areas. Therefore, any small scale changes in land cover did not affect the use of NDVI anomaly for drought monitoring.
The NDVI anomaly used in East Africa was capable of detecting drought conditions since larger regions differs in hydro-climatic conditions with varying rainfall patterns and vegetation cover. The findings from the study suggest that northeastern Tanzania is at greater drought risk than the dry part of northern Sudan despite having low NDVI.
The FEWS NET is a decision support system that provides model derived agro-hydrologic products for drought monitoring such as Crop Water Satisfaction Index (CWSI) or Water Requirement Satisfaction Index (WRSI), Soil Moisture Index (SMI), Evapotranspiration (ET) anomalies and pond water levels. These models are based on the physical principles of energy and mass (water) conservation equations (Senay and Verdin, 2003; Senay et al., 2013a, b; Senay et al., 2015).
FEWS NET Short Term Drought Bulletin
FEWS NET food security analysts rely on a convergence of evidence to make drought and food security assessments (Rowland et al., 2005; Senay et al., 2015). Based on the information generated from multiple indicators, FEWS food security analysts at the NOAA Climate Prediction Center (CPC) produce hazard outlooks on a weekly basis. These outlooks serve as short-term drought bulletins distributed to the regional and national partners for efficient hazard management. The hazard outlook maps are generally based on current weather and climate conditions synthesized from multiple indicators.
Need for Crop Monitoring
It is always important to obtain crop condition information during the crop growing season. Sometimes it is even more important than acquiring the exact production after harvest time. Therefore, along with the development of remote sensing applications, satellite data has become the uppermost data source to monitor large-scale crop condition. During the last two decades, various remote sensing methods have been used to monitor crop conditions which has resulted in not only minimizing the crop losses but has also improved the systems adequately. Direct crop monitoring methods with remote sensing indices such as NDVI or other vegetation indices have been adding values in minimizing the risk to the agricultural sector from natural hazards such as droughts and floods. Time series NDVI data have been used during the cropping seasons and deriving the crop growth profiles from the NDVI statistics at the required scales. While satellite data with high frequency and low spatial resolution is still the main source of data, the method of crop condition monitoring with remote sensing data is also developing over the years from qualitative monitoring to quantitative monitoring; development of more and more vegetation indices and the extensive use of NDVI and NDWI to increase the monitoring precision.
References
Anyamba, A. and Tucker, C.J. (2012). Historical Perspective of AVHRR NDVI and Vegetation Drought Monitoring. Remote Sensing, Drought: Innovative Monitoring Approaches, 23.
Bannari, A., Morin, D., Bonn, F. and Huete, A.R. (1995). A Review of Vegetation Indices. Remote Sensing Reviews, 13 (1): 95-120.
Burgan, R.E. and Hartford, R.A. (1993). Monitoring Vegetation Greenness with Satellite Data. Gen. Tech. Rep. INT- 297, US Department of Agriculture, Forest Service, Intermountain Research Station, Ogden, Utah, 13 p.
Gu, Y., Hunt, E., Wardlow, B., Basara, J.B., Brown, J.F. and Verdin, J.P. (2008). Evaluation of MODIS NDVI and NDWI for Vegetation Drought Monitoring Using Oklahoma Mesonet Soil Moisture Data. Geophysical Research Letters, 35: L22401. DOI: 10.1029/2008GL035772, 2008.
Jensen, J. (2007). Remote Sensing of the Environment. Pearson Prentice Hall.
Ji, L. and Peters, A. (2003). Assessing Vegetation Response to Drought in the Northern Great Plains using Vegetation and Drought Indices. Remote Sensing Environment, 87 (1): 85-98. DOI: 10.1016/S0034-4257 (03)00174-3. Kogan, F.N. (1990). Remote Sensing of Weather Impacts on Vegetation. International Journal of Remote Sensing, 11: 1405-1419.
Kogan, F.N. (1995). Droughts of the Late 1980s in the United States as Derived from NOAA Polar Orbiting Satellite Data. Bulletin of American Meteorological Society, 76: 655-668.
Liang, S. (2005). Quantitative Remote Sensing of Land Surfaces. John Wiley & Sons.
Maselli, F., Papale, D., Puletti, N., Chirici, G., Corona, P. (2009). Combining Remote Sensing and Ancillary Data to Monitor the Gross Productivity of Water-Limited Forest Ecosystems. Remote Sensing of Environment, 113 (3): 657-667.
NASA Earth Observatory: NDVI as an Indicator of Drought. http:// earthobservatory.nasa.gov/ Features/MeasuringVegetation/ measuring_vegetation_3.php
Owrangi, M.A., Adamowski, J., Rahnemaei, M., Mohammadzadeh, A. and Sharifan, R.A. (2011). Drought Monitoring Methodology Based on AVHRR Images and SPOT Vegetation Maps. Journal of Water Resource and Protection, 3: 325-334. DOI:10.4236/jwarp.2011.35041
Payero, J.O., Neale, C.M.U. and Wright, J.L. (2003). Comparison of Eleven Vegetation Indices for Estimating Plant Height of Alfalfa and Grass. Applied Engineering in Agriculture, 20 (3): 385-393.
Perry, C. R., and L. F. Lautenschlager (1984). Functional Equivalence of Spectral Vegetation Indices. Remote Sensing of Environment, 14 (1-3): 169-182.
Peters, A.J., Walter-Shea, E.A., Ji, L., Vina, A., Hayes, M. and Svoboda, M.D. (2002). Photogrammetric Engineering & Remote Sensing, 68 (1): 71-75.
Rouse, J.W., Haas, R.H., Schell, J.A. and Deering, D.W. (1974). Monitoring Vegetation Systems in the Great Plains with ERTS, Third ERTS Symposium, NASA SP-351, pp. 309-317.
Rowland, J., Verdin, J., Adoum, A. and Senay, G., (2005). Drought Monitoring Techniques for Famine Early Warning Systems in Africa. In: Boken, V.K., Cracknell, A.P., Heathcote, R.L. (Eds.), Monitoring and Predicting Agricultural Drought: A Global Study. Oxford University Press, New York, pp. 252-265.
Sharma, A. (2006). Spatial Data Mining for Drought Monitoring: An Approach Using Temporal NDVI and Rainfall Relationships. M.Sc. Thesis. Faculty of Geoinformation Science & Earth Observation (ITC), University of Twente, The Netherlands.
Senay, G.B., Velpuri, N.M., Bohms, S., Budde, M., Young, C., Rowland, J. and Verdin, J.P. (2015). Drought Monitoring and Assessment: Remote Sensing and Modeling Approaches for the Famine Early Warning Systems Network. USGS Staff — Published Research. Paper 858. http://digitalcommons. unl.edu/usgsstaffpub/858.
Senay, G.B., Bohms, S., Singh, R.K., Gowda, P.H., Velpuri, N.M., Alemu, H. and Verdin, J.P., (2013a). Operational Evapotranspiration Mapping Using Remote Sensing and Weather Datasets: A New Parameterization for the SSEB Approach. JAWRA Journal of American Water Resources Association, 49 (3): 577-591.
Senay, G.B., Velpuri, N.M., Alemu, H., Pervez, S.M., Asante, K.O., Kariuki, G., Taa, A. and Angerer, J. (2013b). Establishing an Operational Waterhole Monitoring System Using Satellite Data and Hydrologic Modelling: Application in the Pastoral Regions of East Africa. Pastoralism, 3 (1): 1-16.
Senay, G.B. and Verdin, J., (2003). Characterization of Yield Reduction in Ethiopia Using a GIS-Based Crop Water Balance Model. Canadian Journal of Remote Sensing, 29 (6): 687-692.
Singh, A., McIntyre, L. and Sherman, L. (2003). Microarray Analysis of the Genome-Wide Response to Iron Deficiency and Iron Reconstitution in the Cyanobacterium Synechocystis sp. PCC 6803. Plant Physiology, 132 (4): 1825-1839. DOI:10.1104/pp.103.024018.
Sruthi, S. and Aslam, M.A. (2015). Agricultural Drought Analysis Using the NDVI and Land Surface Temperature Data: A Case Study of Raichur District. Aquatic Procedia, 4: 1258-1264. Sruthi, S. and Aslam, M.A. (2014). Vegetation Stress Analysis Using NDVI at Drought Prone Raichur District, Karnataka. IWRM International Symposium (IWRM2014).
Swets, D.L., Reed, B.C., Rowland, J.D. and Marko, S.E. (1999). A Weighted Least-Squares Approach to Temporal NDVI Smoothing. In: 1999 ASPRS Annual Conference: From Image to Information, Portland, Oregon, May 17-21. Proceedings: Bethesda, Maryland. American Society for Photogrammetry and Remote Sensing.
Thenkabail, P.S., Gamage, M.S.D.N. and Smakhtin, V.U. (2004). The Use of Remote Sensing Data for Drought Assessment and Monitoring in Southwest Asia. Research Report 85. Colombo, Sri Lanka: International Water Management Institute.
Tucker, C. J. (1979). Red and Photographic Infrared Linear Combinations for Monitoring Vegetation. Remote Sensing of Environment, 8(2): 127-150.
Unganai, L.S. and Kogan, F.N. (1998). Drought Monitoring and Corn Yield Estimation in Southern Africa from AVHRR Data. Remote Sensing of Environment, 63: 219-232.
Yengoh, G.T., Dent, D., Olsson, L., Tengberg, A.E. and Tucker, C.J. (2014). The Use of the Normalized Difference Vegetation Index (NDVI) to Assess Land Degradation at Multiple Scales: A Review of the Current Status, Future Trends, and Practical Considerations. Lund University Center for Sustainability Studies (LUCSUS), and the Scientific and Technical Advisory Panel of the Global Environment Facility (STAP/GEF).
Verhulst, N. and Govaerts, B. (2010). The Normalized Difference Vegetation Index (NDVI) GreenSeekerTM Handheld Sensor: Toward the Integrated Evaluation of Crop Management. Part A: Concepts and Case Studies. Mexico, D.F.; CIMMYT.
Zargar, A., Sadiq, R., Naser, B. and Khan, F.I. (2011). A Review of Drought Indices. Environmental Reviews, 19: 333-349.


 (5 votes, average: 4.20 out of 5)


Leave your response!