| Positioning | |
Point cloud acquisition and wall surface extraction using Indoor MMS
In this paper, an approach to acquire 3D data with an indoor mobile mapping system in an indoor environment has been proposed |
|
|
|
|
|
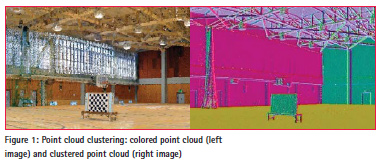
Massive point cloud acquisition is an effective approach for 3D modeling of unknown objects in an indoor environment. Moreover, point-cloud clustering is an essential technique for modeling massive point clouds acquired with a terrestrial laser scanner or mobile laser scanner, as shown in Figure 1.
There are three clustering approaches in point-cloud clustering: model-based clustering [1], edge-based clustering [2], and region-based clustering [3]. Point-cloud data acquired in urban areas and indoor environments often include many complex features with unclear boundaries. Thus, we focused on the region-based point clustering to extract a polygon from a massive point cloud. In region-based clustering, Random Sample Consensus (RANSAC) [4] is a suitable approach for estimating surfaces. However, local workspace selection is required to improve a performance in a surface estimation from a massive point cloud. Moreover, with conventional RANSAC, it is hard to determine whether a point lies inside or outside a surface. In this paper, we proposed an approach to acquire 3D data with an indoor mobile mapping system in an indoor environment.
Moreover, we proposed a point basedrendering methodology to achieve a visualization and polygon extraction for building information modeling (BIM) from the massive point cloud. Then, we described an experiment that was conducted to acquire a massive point cloud with an indoor mobile mapping system along horizontal and perpendicular trajectories. Finally, we confirmed that our proposed methodology could achieve data acquisition for the BIM through pointbased rendering and point cloud clustering from a complex indoor environment.
Methodology
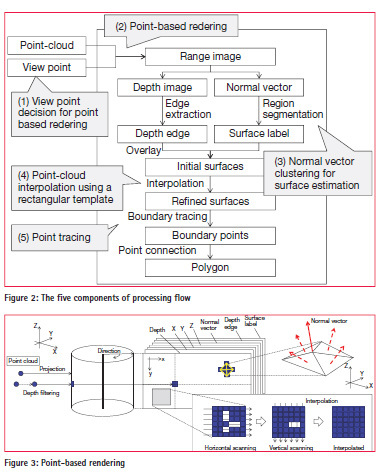
Figure 2 shows our proposed methodology. It consists of: (1) viewpoint decision for point-based rendering; (2) point-based rendering; (3) normal vector clustering for surface estimation; (4) pointcloud interpolation using a rectangular template; and (5) point tracing.
Viewpoint decision for point-based rendering
Viewpoints for point-based rendering are selected in point-cloud data through two steps. In the first step, an orthobinary image is generated from the point cloud to represent a rough floor surface as a viewpoint candidate. In the next step, the orthoimage is eroded with morphology processing to generate a viewpoint candidate network. Intersections on the network are selected as the viewpoints for point-based rendering.
Point-based rendering
Point-cloud visualization has two issues. The first is the near-far problem caused by distance differences between the viewpoint and the scanned points. The second is the transparency effect caused by rendering hidden points among near-side points. These effects degrade the quality of a point-cloud visualization. Splat-based ray tracing [5] is a methodology that generates a photorealistic curved surface on a panoramic view using normal vectors from point-cloud data. The long time period required for surface generation in the 3D work space is a problem. Furthermore, the curved-surface description is inefficient in representing urban and natural objects as Geographical Information System data. Thus, we have applied a pointbased rendering application with a simpler filtering algorithm [6] to generate panoramic range images from a randompoint cloud. The processing flow of pointbased rendering is described in Figure 3.
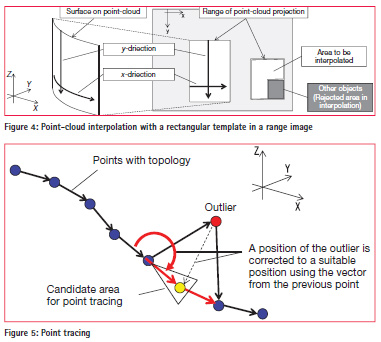
First, the point cloud is projected from 3D space to panorama space. This transformation simplifies viewpoint translation, filtering, and point-cloud browsing. The panorama space can be represented by a spherical, hemispherical, cylindrical, or cubic model. Here, the cylindrical model is described for wall modeling. The measured point data are projected onto a cylindrical surface, and can be represented as range data. The range data can preserve measured point data such as a depth, X, Y, Z, and some processed data in the panorama space in a multilayer style. Azimuth angles and relative heights from the viewpoint to the measured points can be calculated using 3D vectors generated from the view position and the measured points. When azimuth angles and relative heights are converted to column counts and row counts in the range data with adequate spatial angle resolution, a cylindrical panorama image can be generated from the point cloud.
Second, the generated range image is filtered to generate missing points in the rendered result using distance values between the viewpoint and objects. Two types of filtering are performed in the point-based rendering. The first is a depth filtering with the overwriting of occluded points. The second is the generation of new points in the no-data spaces in the range image. New points are generated with the point tracking filter developed in this study.
Moreover, a normal vector from each point is estimated in the range image. Normal vector estimation is often applied to extract features in point-cloud processing. Generally, three points are selected in the point cloud to generate a triangle patch for normal vector estimation. Mesh generation is the basic preprocessing step in this procedure. In 2D image processing, the Delaunay division is a popular algorithm. It can also be applied to 3D point-cloud processing with millions of points [7]. However, using the Delaunay division, it is hard to generate triangle patches for more than hundreds of millions of points without a high-speed computing environment [8] [9]. Thus, we focused on our point-cloud rendering, which restricts visible point cloud data as a 2D image. A closed point detection and topology assignment can be processed as 2D image processing, as shown in the lower right image in Figure 2.
The processing flow of normal vector estimation is described below. First, a point and its neighbors in the range image are selected. Second, triangulation is applied to these points as vertexes to generate faces. Then, the normal vector on each triangle is estimated using 3D coordinate values of each point. In this research, an average value of each normal vector is used as the normal vector of a point, because we used the point cloud taken from a laser scanner that presents difficulties for measuring edges and corners clearly. These procedures are iterated to estimate the normal vectors of all points.
Normal vector clustering for surface estimation
Normal vectors of all points are grouped to detect regions in a range image as a point-cloud classification. The accuracy of point-cloud classification can be improved with several approaches such as the Mincut [10], Markov networkbased [11], and fuzzy-based [12] algorithms. However, in this study, we improved the accuracy with point-cloud interpolation and point tracking. Thus, we applied multilevel slicing as a simple algorithm to classify normal vectors. Moreover, building knowledge is used as a restriction in the normal vector and pointcloud classification. In general, walls in a room and building consist of parallel and orthogonal planes. Thus, four clusters in a horizontal direction are enough to detect walls in a general indoor environment. Although cylindrical surfaces are divided into some clusters, these surfaces can be reconstructed using surface merging. The processing flow of normal vector clustering with restrictions is described below. First, stronger peaks are extracted from a histogram of normal vectors. More than one strong peak is required to detect seed points in each approximate 90° change in horizontal direction. Next, boundaries of clusters are generated from the peaks of the histograms. Then, the normal vectors and point clouds are grouped into four clusters. Finally, initial 3D surfaces are estimated from the grouped normal vectors and point cloud.
This classification detected boundaries of point clusters with the same normal vectors. The point-cloud clustering methodology for extracting the intersection of planes as ridge lines requires appropriate initial values such as curvature, fitting accuracy and distances to closed points [13]. However, our approach can extract boundaries from a point cloud without these parameters.
Point-cloud interpolation with a template Estimated 3D initial surfaces are refined in a point-cloud interpolation procedure. In general, it is difficult to trace the boundaries of the initial surfaces because of holes and jaggy boundaries. Therefore, point-cloud interpolation is applied as a refinement of the initial surfaces in this procedure. When flat and cylindrical surfaces are projected into a range image based on a cylindrical model, these surfaces are represented as rectangles with the following two restrictions. The first restriction is that points have the same X- and Y-coordinate values along the y-direction in the range image. The second restriction is that the points have the same Z-coordinate values along the x-direction in the range image. Based on these restrictions, point interpolation is applied along the x- and y-directions in the range image (see Figure 4). The point interpolation is as follows. First, a rectangular template is fitted to projected points in a range image. Next, missing points are detected in the rectangular template. Finally, the missing points are interpolated using neighboring points. When other objects exist in a rectangular template, the overlapped area is excluded from point interpolation.
Point tracing
Boundaries of features can be estimated from the refined surfaces in a range. Moreover, 3D polygons can be extracted with topology estimation using these boundaries in the range image. In this procedure, a point tracing is required to connect points in 3D space along the boundary, as shown in Figure 5. In general, least squares fitting and polynomial fitting are applied to extract straight and curved lines from points. When the point cloud includes noise, RANSAC is a suitable approach to estimate a feature. However, these approaches require a decision whether straight lines or curved lines are to be extracted before the fitting procedure. In this paper, we wish to extract polygons with a combination of straight and curved lines. Thus, we propose point tracing based on the region-growing approach to extract complex geometry as follows. First, a topology of points is estimated in a range image. When a polyline or polygon is drawn in a range image, continuous 3D points can be extracted. Next, a position for the next point is checked after a seed-point selection. In this step, the position is checked to find whether a possible next point exists or not within a candidate area for point tracing. The candidate area is determined using a vector from the previous point. When a point exists within the candidate area, it is connected to the previous point. Otherwise, the point is assumed to be an outlier, and the position of the point is rectified to a suitable position using the vector from the previous point. These steps are then iterated until the geometry is closed. Finally, 3D points are connected to represent a smooth 3D polygon.
Experiment
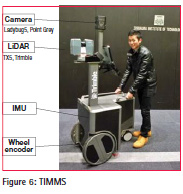
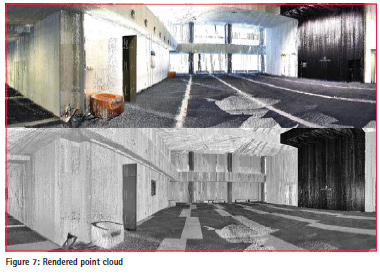
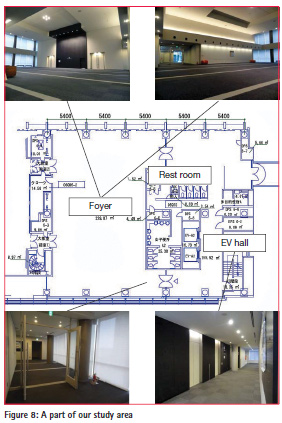
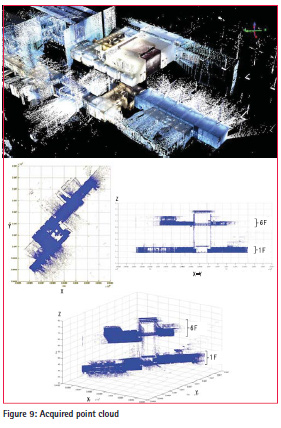
We used the Trimble Indoor Mobile Mapping System (TIMMS) integrated with an inertial measurement unit (IMU), a wheel encoder, a LiDAR system (TX5, Trimble), and an omnidirectional camera (Ladybug 5, Point Grey) (see Figure 6). Figure 7 shows a part of rendering results using acquired point cloud in our study. An entrance foyer consisting of a large room (21.6 m × 21.6 m width) in our university was selected as our study area (see Figure 8). The study area consisted of flat and cylindrical walls, square and cylindrical pillars, a grilled ceiling, doors with glass, and windows. These objects were representative flat and cylindrical surfaces. We acquired a 880-million color point cloud with TIMMS (see Figure 9) in our university. In the experiment, we used a 450-million color point cloud from our dataset.
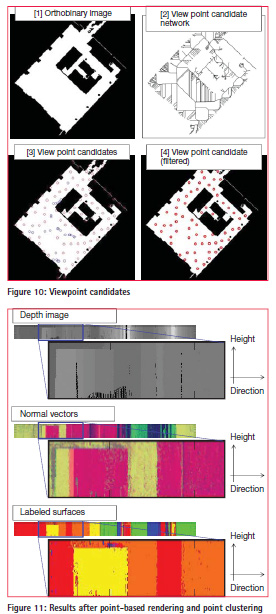
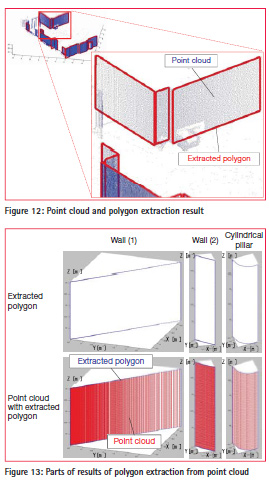
In our experiment, 72 points were extracted as viewpoint candidates for pointbased rendering, as shown in Figure 10. The point cloud taken from TIMMS was rendered from these viewpoints. Figure 11 shows results after point-based rendering and point clustering from a viewpoint. Figure 11 includes a depth image, a depth image, normal vectors, and initial labeled surfaces (overlay of depth edge and labeled surfaces). Each vertical axis shows height direction and each horizontal axis shows direction. Intensity values in the depth image indicate the depth from the viewpoint. Moreover, intensity values in the normal vectors and labeled surfaces indicate the horizontal direction of the point cloud. In addition, color values in the initial surfaces indicate labels of surfaces. In this experiment, spatial resolution was set as 0.2° in the horizontal direction and 2 cm in the height direction. Figure 12 shows a rendered point cloud from a viewpoint in 3D space. The left image shows the input point cloud and the right image shows a result after polygon extraction.
Processing time for the panoramic image conversion and polygon extraction was several minutes in total for each viewpoint using an Intel core i7 2.80 GHz processor with MATLAB (single thread). Parts of the results of polygon extraction from the point cloud are shown in Figure 13. This figure includes examples of general building features, such as a flat wall and a cylindrical wall. Each row shows a result of pointcloud visualization and extracted polygon (boundaries). We have confirmed that point-cloud interpolation in a range image achieved spike noise filtering and geometry smoothing. Moreover, we have confirmed that noise such as the pedestrian was also successfully filtered from the point cloud.
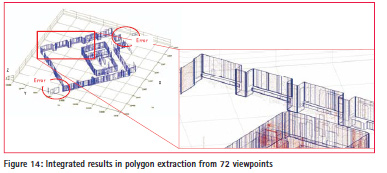
Figure 14 shows integrated results for polygon extraction from 72 viewpoints. Our approach extracted 980 polygons from the point cloud fully automatically. As shown in Figure 14, some polygons that were extracted were failures. Our investigation showed that these failures were caused by LiDAR measurement noise, such as light reflection errors and moving object measurement. Although noise was almost eliminated, the remained noise in the range image affected the point-cloud interpolation.
Summary
We have proposed a method for panoramic rendering-based polygon extraction from indoor mobile LiDAR data. Our aim was to improve region-based point cloud cluster modeling after point-cloud registration.
First, we proposed an approach to acquire 3D data with an indoor mobile mapping system in an indoor environment. Moreover, we proposed a point based-rendering and clustering methodology to achieve a visualization and polygon extraction for building information modeling (BIM) from the massive point cloud. Our proposed methodology consisted of the viewpoint decision for point-based rendering, the normal vector clustering for surface estimation, the pointcloud interpolation with a rectangular template, and point tracing. Then, we described an experiment that was conducted to acquire a massive point cloud with the TIMMS along horizontal and perpendicular trajectories in an indoor environment that included fl at and cylindrical surfaces. Finally, we confi rmed that our proposed methodology could achieve data acquisition for the BIM through pointbased rendering and point cloud clustering from a complex indoor environment.
References
[1] Boyko, A., Funkhouser, T.,Extracting roads from dense point clouds in large scale urban environment, ISPRS Journal of Photogrammetry and Remote Sensing, 66 (2011) S2–S12, 2011.
[2] Jiang, X., Bunke, H., Edge Detection in Range Images Based on Scan Line Approximation, Computer Vision and Image Understanding, Vol.73, No.2, pp.183-199, 1999.
[3] Vosselman, G., G. H. Gorte, B., Sithole, G., Rabbani, T., Recognising structure in laser scanning point clouds. In: ISPRS 2004 : proceedings of the ISPRS working group VIII/2 : laser scanning for forest and landscape assessment, pp. 33-38, 2004.
[4] Schnabel, R., Wahl, R., Klein, R., Efficient RANSAC for Point-Cloud Shape Detection, Computer Graphics Forum, 26(2), 214-226, 2007.
[5] Linsen, L., M¨uller, K., Rosenthal, P., 2007, Splat-based Ray Tracing of Point Clouds, Journal of WSCG, Vol.15, Issue: 1-3, pp.51-58.
[6] Nakagawa, M., Point Cloud Clustering for 3D Modeling Assistance Using a Panoramic Layered Range Image, Journal of Remote Sensing Technology, Vol.1, Iss.3, 10.pp, 2013.
[7] Chevallier, N., Maillot, Y., Boundary of a non-uniform point cloud for reconstruction, SoCG ‘11 Proceedings of the twenty-seventh annual symposium on Computational geometry, pp.510-518, 2011.
[8] Fabio, R., From point cloud to surface : the modeling and visualization problem, International Archives of the Photogrammetry, Remote Sensing and Spatial Information Sciences, Vol. XXXIV-5/ W10, 2003.
[9] Böhm, J., Pateraki, M., From Point Samples to Surfaces, On Meshing and Alternatives ISPRS Image Engineering and Vision Metrology, XXXVI, pp.50 – 55, 2006.
[10] Golovinskiy, A., Funkhouser, T., Min-Cut Based Segmentation of Point Clouds, IEEE Workshop on Search in 3D and Video (S3DV) at ICCV, 6.pp, 2009.
[11] Shapovalov, R., Velizhev, A., Cutting-Plane Training of Nonassociative Markov Network for 3D Point Cloud Segmentation, 3D Imaging, Modeling, Processing, Visualization and Transmission (3DIMPVT), 8.pp, 2011.
[12] Biosca, M., Luis Lerma, J., 2008, Unsupervised robust planar segmentation of terrestrial laser scanner point clouds based on fuzzy clustering methods, ISPRS Journal of Photogrammetry and Remote Sensing, Volume 63, Issue 1, pp.84–98.
[13] Kitamura, K., D’Apuzzo, N., Kochi, N., Kaneko, S., Automated extraction of break lines in tls data of real environment, International Archives of Photogrammetry and Remote Sensing, 38(5), 331-336, 2010.


 (No Ratings Yet)


Leave your response!