| Positioning | |
Mitigating the systematic errors of e-GPS leveling
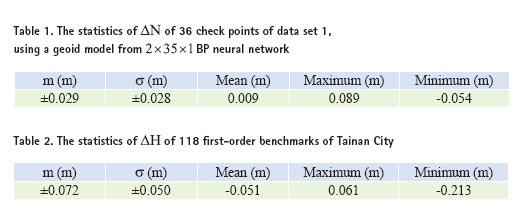
Test results and discussionTainan e-GPS System Tainan City Government has established its e-GPS system in September 2007. The e-GPS system contains 6 reference stations, and covers the whole city. Five reference stations, SCES, NJES, RFES, WHES, BKBL, evenly distributed in Tainan city’s borders, forming a nearly regular pentagon network; and the approximate geographic center in Tainan City setting of the sixth reference station, KAWN, its location just in the pentagonal-shaped center. And, it makes all the distances between the reference stations less than 30 km. In order to improve the accuracy and effi ciency of e-GPS surveying in the mountain area, the seventh reference station, YJLO, was installed in April 2010. Hence, the Tainan e-GPS system has 7 reference stations since then. All reference stations are equipped with Trimble NetR5, and the mobile stations are equipped with Trimble R8. Both types of receivers, Trimble NetR5 and Trimble R8, can track signals from GPS satellites and GLONASS satellites. The distribution map of 7 reference stations of Tainan e-GPS system is shown in Figure 1. Tainan e-GPS system, through the fi eld testing, achieving the following accuracies: ±2cm in plane coordinates (x, y), and ±5cm in ellipsoidal height h, its accuracy is sufficient to be applied to the cadastral surveying, engineering surveying, etc. (Tainan, 2012). Figure 1: The distribution map of 7 reference stations of Tainan e-GPS system. Test data Three data sets of Tainan area (with total area of about 2,192 square kilometers or 219,200 hectares) are used to test the proposed methods. The data sets including: (1) data set 1 of 145 fi rst-order benchmarks, with orthometric height H from fi rstorder leveling and plane coordinates (x, y) and ellipsoidal height h from static GPS surveying of 2003, provided by the Ministry of the Interior, Republic of China; (2) data set 2 of 145 fi rst-order benchmarks, with orthometric height H only from fi rst-order leveling of 2009, provided by the Ministry of the Interior, Republic of China; (3) data set 3 of 118 fi rst-order benchmarks, with plane coordinates (x, y) and ellipsoidal height h from Tainan e-GPS system of 2011, provided by Tainan City Government. Test results and discussion Accuracy Analysis of e-GPS Leveling: The following procedures are performed to evaluate the accuracy of e-GPS leveling: (1) Train a 2 x p, x 1BP neural network (2) represents the input layer has two elements, plane coordinates (x, y) of each benchmark; p1 denotes the number of neurons in the hidden layer; 1 represents the output layer has 1 element, undulation N of each benchmark), in order to construct a regional geoid model of Tainan City, with 145 first-order benchmarks of data set 1; (2) Estimate undulation of all 118 first-order benchmarks of data set 3, using the trained 2 x p1 x 1 BP neural network and the plane coordinates (x, y) of each benchmark; (3) Calculate the orthometric height , using the formula of According to the preceding procedure 1, in order to construct a regional geoid model of Tainan City with BP neural network, 145 fi rst-order benchmarks of data set 1 are divided into two groups, one group as the reference point (109 points) to train a BP neural network; another group as a check point (36 points) to assess the accuracy of the regional geoid model. Since orthometric height H and ellipsoidal height h of each benchmark of data set 1 are known, the undulation N of each benchmark can be calculated using the formula N = h – H . And, it is assuming that N is the true value. Suppose further that the undulation of each benchmark estimated by the trained BP neural network is , then, the undulation difference where i = 1,2,…,n stands for the sequential number of check points; n is the total number of check points. After trial and error tests, it is found that a 2 x 35 x 1BP neural network can offer better regional geoid model accuracy (Lin, 2007; Lin, 2012). The statistics of Based on the previously mentioned procedures 2 to 4, compute the height difference The accuracy of h from e-GPS system is ± 0.050m (Tainan, 2012). Besides, the accuracy of estimated undulation By definition of Test results of proposed methods:
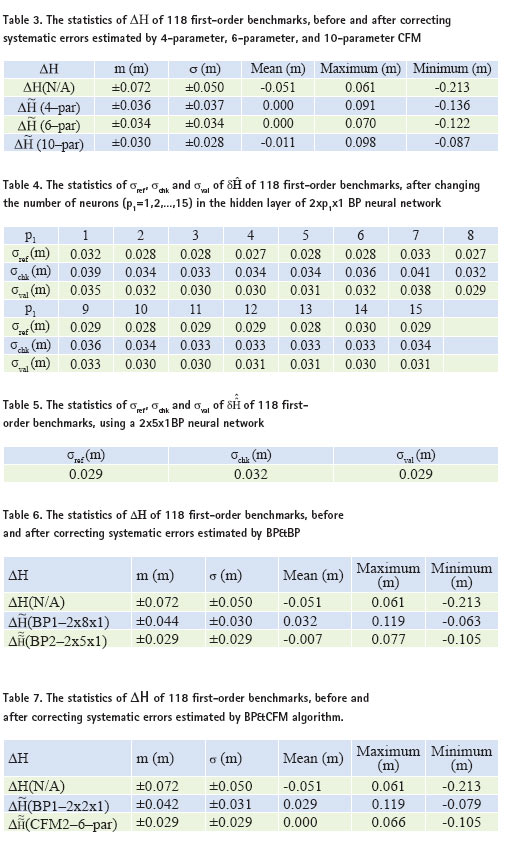
Test results of CFM Based on the above-mentioned procedures of CFM, data of 118 fi rstorder benchmarks are used to test the performances of 4-parameter, 6-parameter, and 10-parameter CFM. The statistics of ΔH of 118 firstorder benchmarks, before and after correcting systematic errors estimated by 4-parameter, 6-parameter, and 10-parameter CFM, are shown in Table 3. In Table 3,
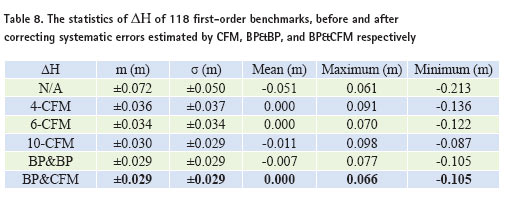
Can be seen from the results in Table 3, after correcting systematic errors estimated by 4-parameter CFM, the standard deviation of Test results of BP&BP Based on the specific procedures of BP&BP, systematic errors of e-GPS leveling,
Then, the number of neurons p2 of 2 x p2 x 1BP neural network is determined, using trial and error method, with
Table 6 shows that the statistics of Test results of BP&CFM Based on the specific procedures of BP& CFM, systematic errors of e-GPS leveling,
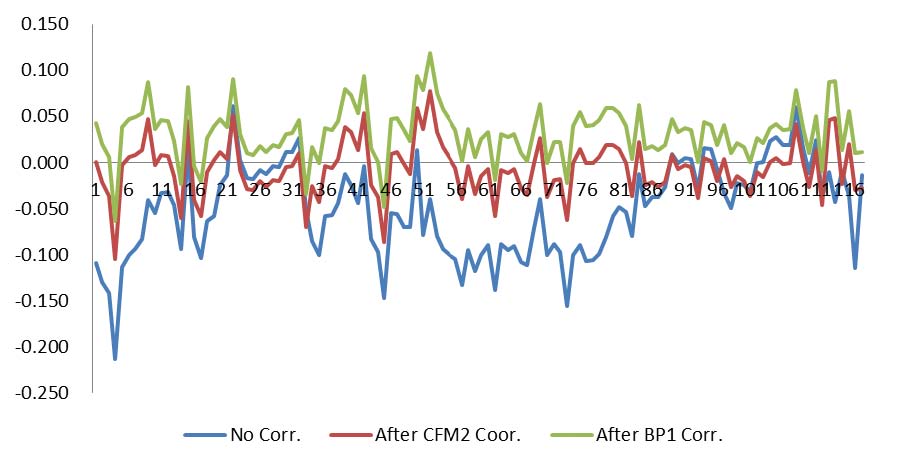
Table 7 shows statistics of ΔH of 118 first-order benchmarks, before and after correcting systematic errors estimated by BP&CFM. In Table 7, ΔH(N/A) denotes the value of ΔH before correcting systematic errors; It can be seen from the results in Table 7, after correcting systematic errors estimated by a 2 x 2 x 1BP neural network, the standard deviation of Summary The statistics of ΔH of 118 fi rst-order benchmarks, before and after correcting systematic errors estimated by CFM, BP&BP, and BP&CFM respectively, are summarized and shown in Table 8. In Table 8, N/A stands for the value of ΔH without any systematic error correction; 4-CFM, 6-CFM and 10-CFM denote values of Figure 2. The ΔH comparison charts of 118 fi rst-order benchmarks, before and after correcting systematic error estimated by BP&CFM. Can be seen from the results of Table 8, after systematic error correction estimated by CFM, BP&BP, and BP&CFM, the standard deviation of ΔH can be reduced considerably. Among them, the performances of BP&CFM and BP&BP are the best. In terms of reduced the mean of ΔH, BP&CFM, 4-CFM and 6-CFM perform the best. Then, it is checked that whether the mean square error of ΔH is equal to the standard deviation of ΔH or not? It is found that BP&CFM, BP&BP and 6-CFM meet the requirements. Therefore, on three aspects into consideration, i.e. (1) Is the standard deviation of ΔH the smallest? (2) Is the standard deviation of ΔH equal to the mean square error of ? (3) Is the mean of ΔH is equal to 0.000m? It is found that the performance of BP & CFM is the best, and followed by BP&BP. The ΔH comparison charts of 118 fi rst-order benchmarks, before and after correcting systematic errors estimated by BP&CFM, are shown in Figure 2. In Figure 2, “No Corr.” denotes the value of ΔH before correcting systematic errors; “After BP1 Corr.” and “After CFM2 Corr.” denote values of ΔH after correcting systematic errors estimated by 2X2X1BP neural network and 6-parameter CFM respectively; the vertical axis expresses the value of ΔH (m); and the horizontal axis stands for the sequential number of 118 fi rst-order benchmarks. ConclusionsAddress the systematic errors of estimated orthometric height of e-GPS leveling, three methods, i.e. CFM, BP&BP, and BP&CFM, are proposed in this paper. Three data sets of Tainan City are used to test the proposed methods. The test results show that, among the three methods, BP & CFM is the most effective way to mitigate the systematic errors of e-GPS leveling, followed BP&BP, and 6-parameter CFM. Using BP & CFM algorithm, for example, the standard deviation of is reduced to ±0.029m from ±0.050m and the mean of ΔH is equal to 0.000m. In this paper, it is found that the systematic errors of e-GPS leveling can be mitigated effectively if BP&CFM is applied, using the data sets from Tainan City. However, if the test area is increased, such as the southern region of Taiwan, and even extended to the entire island of Taiwan, the BP & CFM algorithm, is still valid? Remains to be further validated in the future. AcknowledgementsData sets of 145 fi rst-order benchmarks of Tainan City, provided by the Satellite Surveying Center of the Ministry of the Interior; data set of 118 fi rst-order benchmarks from Tainan e-GPS system , provided by the Tainan City Government; ReferencesReferences from Journals Hu, W., Y. Sha, and S. Kuang, 2004, New method for transforming global positioning system height into normal height based on neural network, Journal of Surveying Engineering, 130(1), pp. 36-39. Hu, W. and L. Sun, 2009, Neural network based method for compensating model error, Journal of Southern University (English Edition), Vol. 25, No. 3, pp. 400-403. Kavzoglu, T. and M.H. Saka, 2005, Modelling local GPS/ leveling geoid undulations using artifi cial neural networks, Journal of Geodesy, 78, pp. 520-527. Kuhar, M., B. Stopar, G. Turk, and T. Ambrozic, 2001, The use of artifi cial neural network in geoid surface approximation, AVN. Allg. Vermess.- Nachr., jahr. 108, 1, pp. 22-27. Lin, L.S., 2007, Application of a Back-Propagation Artificial Neural Network to Regional Grid- Based Geoid Model Generation Using GPS and Leveling Data, Journal of Surveying Engineering, 133(2), pp.81-89. Lin, L.S., 2012, Study on the accuracy of e-GPS leveling, Accepted by Journal of Taiwan Land Research. Stopar, B., T. Ambrozic, M, Kuha, and G. Turk, 2006, GPS-derived geoid using artifi cial neural network and least squares collocation, Survey Review, 38 (300), pp. 513-524. Yang, M., K.H. Chen, and S.W. Shiao, 2003, A new height network in Taiwan, Survey Review, 37 (290), pp. 260-268. Zaletnyik, P., L. Völgyesi, and B. Paláncz, 2008, Modelling local GPS/levelling geoid undulations using Support Vector Machines, Periodica polytechnic, Civil Engineering, 52/1, pp. 39-43. References from Books Ghilani, Charles D., 2010, Adjustment Computations: Spatial Data Analysis, 5th Edition, Wiley, John Wiley & Sons, Inc. References from Other Literature Tainan City e-GPS System Portal, 2012, http://egps.tainan.gov.tw. |
![]()


 (4 votes, average: 2.50 out of 5)


Leave your response!