| GNSS | |
Local GNSS Monitoring
The present article describes a promising jamming detection solution developed during the HONTZA project |
 |
|
 |
|
Nowadays, GPS are used in many applications such as GBAS, SBAS, EGNOS and WAAS aircraft landing systems, unmanned road or aerial vehicles, wireline and wireless telecommunications networks, financial trading, electricity generation and supply, telematics insurance, tracking of assets, fl eet vehicles and people, road user charging, geofenced applications … etc.
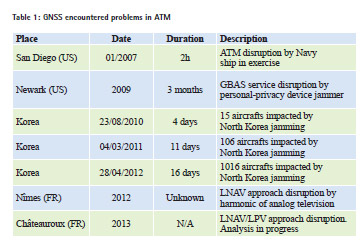
GPS applications are vulnerable to jamming and spoofing, the former being intentional or not. Such interferences have a high damage potential. Time spoofing can also help a hacker misappropriating funds from a bank. As example, Table 1 lists some GNSS encountered problems in ATM. The best known example of GPS jamming is the Newark incident, where air traffic was disrupted due to a GPS jammer (PPD, Personal Privacy Device) moving along the airport.
This table highlights that intentional interferences really impact ATM and unintentional interferences effects on ATM should be taken into account. Jamming and spoofing threats draw a growing interest from the scientific and industrial GNSS community.
The article is organized as follows: the first section introduces the context of the HONTZA project and its actors. The second part details the local GNSS monitoring system architecture. The third part shows the results obtained during on-site tests and during the 3 months period. The last part describes future works envisaged.
HONTZA project
Context
The HONTZA project investigated GNSS vulnerabilities for maritime navigation with respect to the issue of voluntary or involuntary GNSS interferences. The aim of the project was to assess the impact of a commercial jammer freely available online on boat onboard equipment and on harbor facilities, and to deploy solutions to mitigate the risks. HONTZA is a collaborative project funded by the Conseil Régional Aquitaine and performed by Thales and its partners within the TOPOS cluster [1].
Whenever a jamming or spoofing event is detected around the harbor of Bordeaux, the solution developed, which will be introduced in next chapter, provides an alert to the master’s office.
Actors of the project
The actors of the HONTZA project were:
• GPMB (Grand Port Maritime de Bordeaux): they provided equipment for on-site tests.
• HELILEO: they were in charge of the GNSS sensor tests
• AGUILA: they were in charge of the GNSS sensor development
• MAXSEA: they were in charge of the server part
• THALES AVIONICS: we were in charge of the system requirements definition and the safety algorithm to detect spoofing or jamming.
Proposed solution for local GNSS monitoring
The aim of the solution is to be able to inform user in real-time:
• Of the GNSS signals availability and quality,
• Of the presence of interference sources,
• Of the origin of interference sources.
This solution could be typically used in transport environment (seaport, airport …) or for guidance operation where accuracy is critical. Next part will describe the system architecture.
Solution architecture
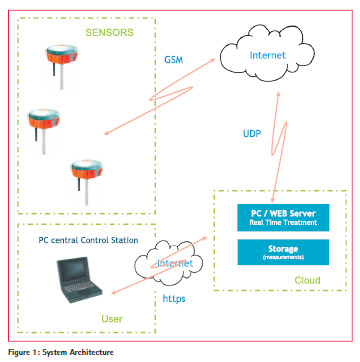
The local GNSS monitoring system is constituted of 2 main subunits:
• The “GNSS sensor” subunit is spread on the critical zone to monitor. Its role is to collect GNSS signals and GNSS information (level of satellite signals, RF Front End data, position information …) and then to transmit these information to an “web server” via a GSM link and Internet connection.
• The secured server subunit is hosted on cloud, its role is to elaborate and store information data displayed to the user, on a distant PC hosted on the system client, through an HTTPs Human Machine Interface.
Figure 1 illustrates system architecture of the proposed solution.
Simulation test with STK
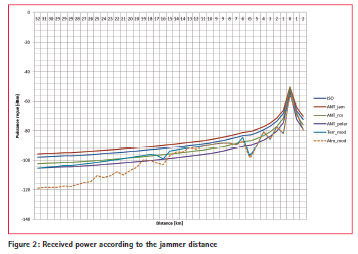
The HONTZA solution is based on the deployment of sensors on the area to cover along the Gironde River. Jammer is simulated on the Aquitaine Bridge. Jammer simulates a Personal Privacy Device (PPD) with a continuous wave (CW) on L1 frequency (1575.42MHz) with a power of 1W.
According to the number of sensors available for the project (3 sensors) and the area to cover, 3 places to put the sensors have been identified:
• Paulliac: sensor is not affected by the jammer, sensor status is OK,
• Macau: sensor is a little affected by jammer and sensor is in degraded mode,
• The harbor office: sensor is fully affected by jammer and sensor status is KO. Thanks to the STK software (System Tool Kit) provided by AGI [2], the received power has been modeled for the 3 places identified. Figure 2 provides the received power according to the distance from the jammer (different types of propagation model and antenna are considered). These powers are needed for on-site tests.
Laboratory tests
Laboratory tests have been conducted in order to assess system performance. Tests have been performed on user receiver and on GPS sensors.
User receiver interference tests
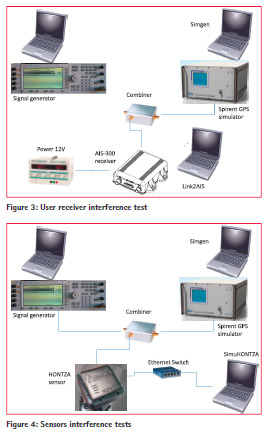
The user receiver was an AIS ACR Electronics AIS-300 receiver provided by TOPOS. The interference was generated by a signal generator and then it was combined with a GPS signal simulated with a Spirent, as illustrated in Figure 3.
“Simgen” and “Link2AIS” software are commercial software given with Spirent simulator and the AIS-300 receiver.
Sensors interference tests
The configuration of sensors interference tests was the same as the user receiver interference test, using the GPS HONTZA sensor instead of the user receiver. The RF signal (GPS + interference signal) is injected between the antenna and the receiver. Sensors interference tests allowed verifying the sensor status according to the jamming level (OK, degraded, KO). After laboratory tests passed, on-site tests have been conducted.
On-Site tests
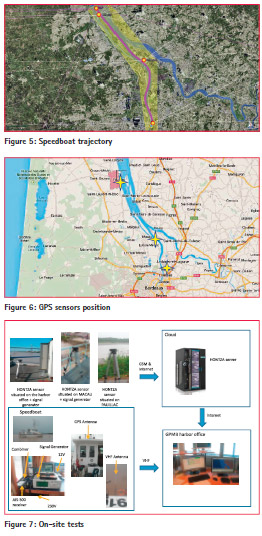
Tests have been done on GPMB (Grand Port Maritime de Bordeaux). A hydrographic speedboat equipped with a user receiver was used to navigate, along a predefined trajectory (purple trajectory in Figure 5).
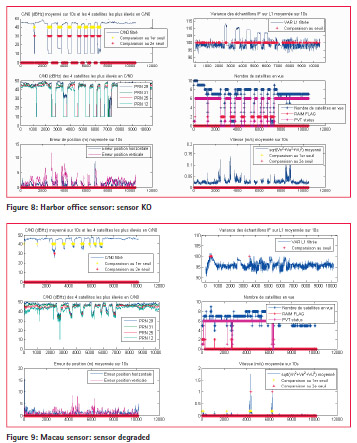
The speedboat was also equipped with a GPS receiver that will be used to get the reference trajectory. HONTZA sensors were spread on 3 different zones as depicted in Figure 6. Each of 4 GPS receivers (3 HONTZA sensors and the user receiver) received the real GPS signal coming from its antenna. As for laboratory tests, interference was conducted after the antenna of each receiver (jamming is switch on 5 minutes roughly after that it is switch off). Interference injected simulates a jammer which circulates on the Aquitaine Bridge.
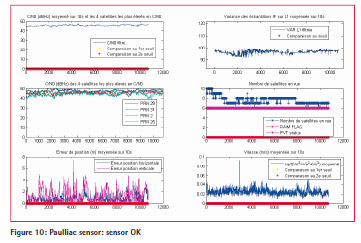
Server is linked to supervision system of the GPMB harbor office as illustrated on Figure 7.
Results obtained for the 3 HONTZA sensors during the test between Paulliac and the harbor office are given hereafter.
As expected, the sensor placed on the harbor office is affected for each jamming (see Figure 8).
Sensor situated on Macau is only on degraded mode, as expected (see Figure 9). Sensor placed on Paulliac is not affected by jammer (so no interference was injected) and as expected, sensor is not impacted (see Figure 10).
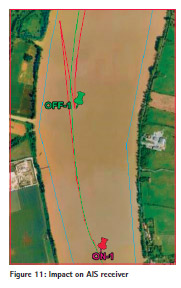
Impact on the AIS monitoring system is depicted in Figure 11. The green trajectory corresponds to the reference, provided by the on-board GPS receiver not affected by jamming. The red trajectory corresponds to the trajectory elaborated from AIS data. Jamming was activated on step named ‘ON- 1’ and deactivated on step named ‘OFF-1’. It can be observed that AIS monitoring system provides an extrapolated boat position during jamming, taking into account parameters available before jamming (speed, heading …). It’s why in Figure 11, the boat estimate position is close to the Earth whereas the boat is really in the middle of the river.
First lessons learnt
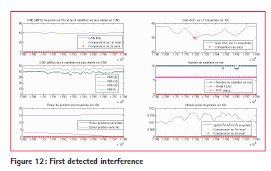
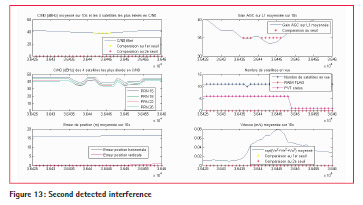
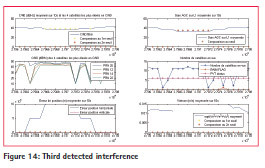
After the on-site test, one of the sensors was left in place during 3 months on the harbor office, in order to evaluate interferences over a long period. 5 interferences have been detected during this period and are illustrated in figures 12, 13, 14, 15 and 16.
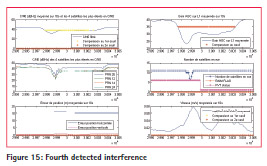
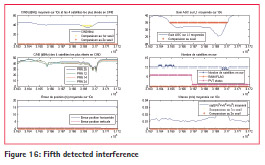
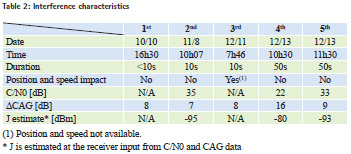
The 5 detected interferences in 2014 are summed up in Table 2. Assuming jammer power is 1W, the approximate distance of the jammer from the receiver is 9km for the 2nd and 5th interferences and 2km for the 4th interference.
Future works
The future works envisaged are to detect and also to locate and characterize jammer:
• Power spectrum,
• type of interference: Continuous Wave (CW), Wide Band (WB),
• Duration of the interference,
• Jammer localization,
• Number of jammer.
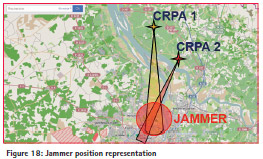
In order to locate the jammer position, CRPA (Controlled Reception Pattern Antenna) sensors are envisaged. CRPA provides the DOA (Direction Of Arrival) of the jammer.
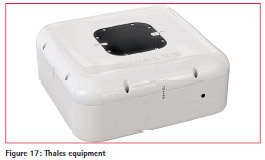
Thales offers a professional solution to detect jamming of GPS and Galileo frequencies and localize up to 3 sources simultaneously. The solution comprises a digital antenna electronics (DAE) unit, combined with a four-element CRPA, making a versatile solution for any area of usage (see Figure 17).
Then, jammer localization information is sent to a server in order to provide a representation of the jammer position (as shown in Figure 18).
Conclusion
The present article describes a promising jamming detection solution developed during the HONTZA project. Using this solution, we were able to detect 5 interferences in GPMB during the tests period. When compared to results obtained by other studies which detected up to one hundred events in a month, these results suggest that a fine tuning of detection thresholds is necessary to raise relevant alarms. The solution we propose provides the right alert at the right time and avoids false alarms.
`The next step is to provide the jammer position localization. To do this, CRPA sensors will be integrated in the HONTZA system.
References
[1]: http://www.topos-aquitaine.org/
[2]: www.agi.com


 (No Ratings Yet)


Leave your response!