| Applications | |
Geospatial land governance and management
The present research discover the people’s role in land governance and management, and also to see the historical background of land governance in India. We have published the first part of the paper in the last issue. We present here the concluding part |
 |
|
Geospatial trends of agricultural development
The Agricultural progress of any region is generally influenced by the number of factors such as the physical, institutional, infrastructural and technological factors. All these factors are individually or collectively are responsible for the cropping patterns, level of agricultural development and agricultural productivity in an area or region. The institutional factors includes the land tenancy, land tenure and land ownership. These factors have their performance on field size, field patterns, farming type, crop land use, crop association and productivity of the crops, particularly in the country, India. In addition to this, there is found an increasing agricultural production due to the introduction of new technological inputs at large in different parts over the periods in the country, India. The details of the agricultural productivity since 1950- 51 to 2010-11 is presented in the Table 2. For instance, during initial period 1950- 51, the yield per hectare was about 522 kgs. per hectare which was continuously increased over the periods in different five year plans as evidenced by the Table 2. Whereas, there was about 124.75 million hectares of area under cultivation in 1981-82 and the total output in that period was of 1,032 kgs. per hectare. It was resulted due to the green revolution during 1960’s in the country, India. In continuation to this, there was recorded an increasing output, as it was about 2,079 kgs. per hectare achieved during the period of 2010-11. In continuation to this, the trends of land use under major crops have also been found varying over the periods beginning from 1950-51 to 2011-13 as presented in the Figure 13.
Subsequently, the green revolution effected to an increasing trend in the output from 1980-81 onwards. It may also be remembered that the average holding in India is 1.33 hectares in 2000-01. So, the small farms ensure to have a direct impact on poverty. It is important to see on whose field the production takes place rather than how much the production has increased. The agricultural production by poor farmers will contribute the most towards decreasing hunger and malnutrition (Raj, 1975). So, it is evidenced that more equal distribution of land to small farmers is viable. And, the broad support base of redistribution should significantly raise productivity and improve the livelihood of the poorest peasant in the country, India.
Geospatial trends of agricultural land governance
Operational land holdings
An operational holding is well-defined as a unit of land used solely or partly for agricultural production and operated or managed by one person alone, or with the assistance of others without regard to the title, size or location (Sanyal, 1988). Area under operational holdings is called operated area. The number of operational holdings improved speedily from 51 million in 1960-61 to 101 million in 2002-03, which is reasonable considering the growth of population. On the other hand, the rate of growth of operational holdings, which enhanced over the three decades from 1960-61 to 1991-92, seems to have reduced miserable in the decade preceding to 2002-03. Whereas, there was total operated area of 133 million hectares in 1960-61 which dropped to 126 million hectares in 1970-71 which was a net fall of about 5.8 per cent. It plunged by around 5.6 per cent once more during 1970-71 and 1981-82. Whereas, there was an area of 108 million hectares which extent decreased to about 8.0 per cent since 1981-82, that was in the last 21 years, which remained consistent with the declining trend as observed up to 1981-82.
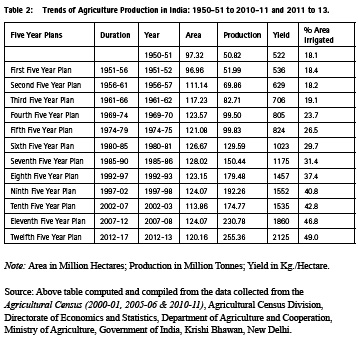
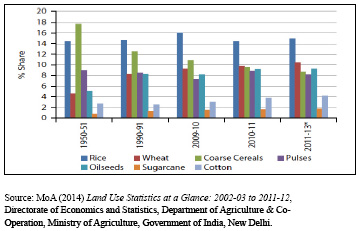
Fig 13: Trends Land Use under Major Crops for India: 1950-51 to 2011-13
Marginalisation of holdings
Customarily, a common feature of the size distribution of operational holdings is that the percentage of holdings decreases as the holding size increases. The percentage distribution of operational holdings expose that the decline is getting progressively sharper with every decade over the periods. The percentages of large, medium and semi-medium holdings have been declining steadily since 1960-61 to 2000-01.
The decline is sharpest for large holdings which decreased from 4.50 per cent to 0.80 per cent. On the contrary, it was witnessed that a great gathering of holdings found into the “marginal” category. The percentage of land holdings in this category was increased from 39.00 per cent in 1960-61 to 70.03 per cent in 1991-92 in the country, India.
Division of operational holdings
Due to the pressure of growing population on the limited land base and the subsequent division of holdings is obviously reflected in the variations in the absolute numbers of operational holdings in different size classes in the country, India. As it is evidenced that the trends in the number of operational holdings in different categories from the period 1960-61 to 2002-03 that the numbers of operational holdings in different categories are not changing at the same rate, or even in the same direction over periods.
In the beginning, over the three decades the number of marginal holdings has increased from 19.8 million in 1960-61 to over 71.0 million in 1991-92 which shows an increase of over three and a half times over the periods. Similarly, the number of small holdings, too, has been found growing, though at a much slower rate, since 1970-71. On the other hand, the absolute numbers of large and medium holdings have declined gradually during this period. In addition to this, the number of semi-medium holdings, which had persisted unchanging at 10 million from 1960-61 to 1981-82 and even showed signs of an increase, was prompted to decrease.
Distribution of operated area by holdings from 1960–61
The percentage distributions of operated area by category of operational holdings demonstrate that the portions of marginal holdings in total operated area, which was about 7.02 per cent in 1960-61, intensified rapidly over the last four decades and again increased by about 6 to 7 percentage since 1991- 92 to equalise with the proportion of the semi-medium and medium holdings around 22.50 per cent. Likewise, the proportion of small holdings, as well, has been continuously increased and is currently over 20.03 per cent.
While the proportion of large holdings has been gradually declined as from 29.04 per cent in 1960-61 to around 12 to 13 per cent in 1991-92. The proportion of area operated by medium holdings has decreased gradually but more moderately, and the proportion of semi-medium holdings appears to have reached its highest level in 1991-92 and thereafter started to increase over the periods.
Distribution of operated area by holdings from 2010–11
The agricultural land is bifurcated among the peoples according to the existing law of inheritance, due to the population explosion over the periods in the country, India. The average size of operational holdings was about 1.16 hectares in 2010-11 in India. Such figure is much below the world average size of about 5.50 hectares. The trends of agricultural output since the independence for over the periods 1950-51 to 2010-11 and for the latest period 2011 to 2013 for the country, India is presented by the Figure 13.
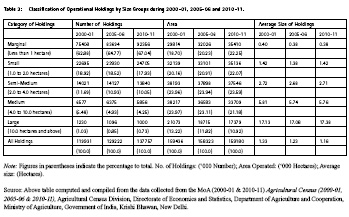
The details of number and area of operational holdings in the country, India, based on the results of latest Agriculture Censuses 2000-01 to 2010-11 are presented in the Table 3. There is found a large proportion of about 67.04 per cent of land holdings which are having less than 1 hectare in 2010-11 in India. In addition to this, the small land holding is accounted for about 17.93 per cent and possessed land ranges between 1 to 2 hectares. These holdings together accounted for about 84.97 per cent of the land holdings in the country, India as evidenced by the Table 3. So, such marginal and small land holding are not seems to be viable economically. The fact is that all these land holders cannot produce enough to meet out the cost of cultivation like irrigation, High Yielding Variety (HYV) seeds, chemical fertilisers, insecticides, pesticides and agricultural machinery. During 2010-11, there was about 44.32 per cent of land area which was held by marginal and small holdings ranges less than 1 hectare and 1.0 to 2.0 hectares, respectively as evidenced by Table 3. The semi-medium holdings ranges 2.0 to 4.0 hectares accounted for about 23.59 per cent of the land area.
The medium holdings accounted for about 21.18 per cent of the land area. So, there is majority of the marginal and small holdings as well as the semi-medium and medium holdings accounted large proportion of land area in the country, India. The small and marginal holdings while taken together i.e. the below 2.00 hectares is constituted about 84.97 per cent in 2010-11 against 81.80 per cent in 2000- 01 and the operated area was about 44.32 per cent in the current census 2010-11, as against the corresponding figure of 38.86 per cent in 2000-01. The semi-medium and medium operational holdings which are ranging between 2.00 to 10.00 hectares in 2010-11 were accounted for about 14.30 per cent with the operated area of 44.77 per cent. The corresponding figures for 2000-01 and 2010-11 censuses accounted for about 17.17 per cent and 47.93 per cent, respectively. The large holdings ranging between 10.00 hectares and above accounted for about 0.73 per cent of total number of holdings in 2010-11 with a share of 10.92 per cent in the operated area as against 1.03 per cent and 13.22 per cent, respectively in 2000-01 as evidenced by the Table 3. So, whichever momentous change occurs in agrarian structure would have some impact on the size distribution of land holdings in the country, India.
Geospatial state-wise patterns of average size operational holdings
In the country, India as a whole, out of 35 States and Union Territories (UTs), there was found that 13 States namely the Andhra Pradesh, Bihar, Chhattisgarh, Gujarat, Karnataka, Kerala, Madhya Pradesh, Maharashtra, Odisha, Rajasthan, Tamil Nadu, Uttar Pradesh and West Bengal altogether accounted for about 91.00 per cent of the number of operational holdings with a share of about 88 per cent operated area during the period 2010-11. Whereas, there was about 138.35 million operational holdings in the country, in which the highest one belonged to Uttar Pradesh State which accounted for 23.33 million and followed by Bihar 16.19 million, Maharashtra 13.70 million, Andhra Pradesh 13.18 million, Madhya Pradesh 8.87 million, Tamil Nadu 8.12 million, Karnataka 7.83 million, West Bengal 7.12 million, Rajasthan 6.89 million, Kerala 6.83 million etc. with the lowest of only 714 operational holdings in Union Territory of Chandigarh. Besides this, out of a total of 159.59 million hectares operated area in the country in 2010- 11, the highest contribution was made by Rajasthan State with an area of 21.14 million hectares followed by Maharashtra 19.77 million hectares, Uttar Pradesh 17.62 million hectares, Madhya Pradesh 15.84 million hectares, Andhra Pradesh 14.29 million hectares, Karnataka 12.16 million hectares, Gujarat 9.90 million hectares etc. with the lowest operated area of 923 hectares in the Union Territory of operational holdings as well as the operated area in the country in 2010-11.
As compared to 2005-06, percentage increase in number of operational holdings in 2010-11 was the highest in case of Goa which is 47.71 per cent followed by Madhya Pradesh 12.19 per cent, Rajasthan 11.35 per cent, Bihar 10.47 per cent, Daman & Diu 9.60 per cent, Andhra Pradesh 9.39 per cent, Chhattisgarh 8.26 per cent, Odisha 7.14 per cent, Pondicherry 5.56 per cent, Nagaland 5.41 per cent, and Jammu & Kashmir 5.20 per cent, and so on. Nevertheless, the operated area showed declining trend in most of the States. In addition to this, the Tables 4 presents figures for altogether state-wise average size of operational land holdings for all the social groups for the periods of 2000-01, 2005-06 and 2010-11 for country, India.
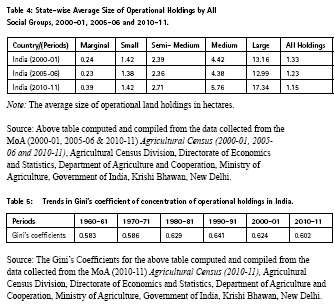
Table 4 helps in comparison of all the State-wise altogether average size of operational land holdings among the social groups as well as over the periods for the country, India as a whole. The size of marginal land holdings was marginally increased from 0.24 to 0.39 from 2001- 01 to 2010-11 for the country as a whole, respectively. Likewise, semi-medium, medium and large land holdings showed an increasing trend over the periods. Whereas, it is important to point out that the all holding size was marginally decreased over periods as evidenced by the Table 4.
As per the Agriculture Census 2010- 11, the total number of operational holdings in the country was increased from 119.93 million in 2000-01 to 137.76 million 2010-11 i.e. an increase of 17.83 million holdings over a decade period. Whereas, there was marginal decrease in the operated area from 159.44 million hectares in 2000-01 to 159.18 million hectares in 2010-11 showing a decrease of 0.26 per cent. The operated area was primarily increased because the State of Jharkhand participated for the first time in Agriculture Census operation in 2010- 11 after the state came into existence in the year 2000. The average size of operational holding was of 1.15 hectares during 2010-11 in the country, India.
Geospatial concentration trends of operational holdings
In order to comprehend the trends of operational land holdings, the Gini’s coefficient of concentration is used to obtain an overall measure of concentration in the size distribution of operational holdings for the country, India. The values of coefficients are computed for the periods 1960-61, 1970-71, 1981-82, 1990-91, 2000-01 and 2010-11 as presented in Table 5. In general, there is found an increasing trends of the concentration of operational land holdings over the periods in the country, India as also evidenced by the Table 5.
In lieu of this, there is found an increasing trends of concentration at the states level in the country as is evidenced by the Gini’s coefficient values which shows the degree of concentration in operational holdings which increased since 1960-61. Later on, such increasing trend has been slowed down since 1990-91 and further continued to decreasing over period’s up to 2010-11 as evidenced by the Table 5.
Geospatial concentration patterns of operational holdings
The Gini’s coefficient values presented in the Table 6 showed the deviations in the degree of concentration in the size distribution of operational holdings in all the 15 major States over the periods 1970–71, 1980–81, 1990–91, 2000–01 and 2010–11 for the country, India. To ensure proper comparability, it has been necessary to use, for computation of the coefficient, the distribution of land holdings by category at the state level for all the periods. Extraordinarily, there is a slowing down in the increase in concentration since 1980-81. In fact, the coefficient value for period of 1990–91 is slightly lower than that for period of 1980-81. It is also discernable from the Table 6 that there is a varying trends in the Gini’s coefficient across the states in the country, India. Whereas, in case of the States like the West Bengal, Bihar (including Jharkhand), and Orissa, the index of concentration was decreased sharply since 1990–91. Similarly, in case of the Assam, Uttar Pradesh (including Uttaranchal), and Tamil Nadu, the index was decreased in both the periods 1980–81 and 1990–91. Similarly, in Kerala State, there was steady decrease in the index since 1970– 71 as evidenced by the below Table 6.
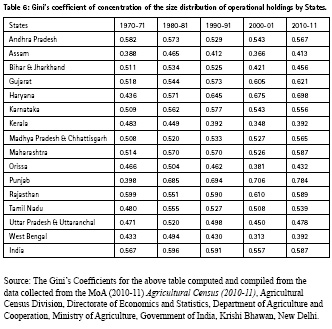
On the contrary, in case of the State Karnataka, Madhya Pradesh (including Chhattisgarh), Maharashtra and Rajasthan, there was no clear trend discernible in terms of the degree of concentration in the size distribution of operational holdings over the periods. However, it is noteworthy to mention that the two most agriculturally developed States of Punjab and Haryana were displayed the most pronounced increase in the concentration ratio since 1970–71. In case of the Haryana State, the ratio increased substantially over the periods since 1970–71. Whereas in case of the Punjab State, the ratio increased sharply from 0.398 in 1970–71 to 0.685 in 1981– 82. This was followed by a smaller increase in the next two periods and so on up to 2010–11. In addition to this, in case of the Gujarat State, there was steady, though more gradual, increase in the index of concentration over the periods since 1970– 71 to 2010–11 as evidenced by the Table 6.
Conclusions
Geospatial land governance and management through digitalisation is a noteworthy matter of concern in the emerging economies and developing countries of the world, like India. In agrarian economies, the land is most important assets of the people. Besides this, ‘to own the land is the highest mark of esteem; to perform manual labour, the lowest’. There is an ever-changing relationship between land, power and people. Ancient records show that, among the Indo-Aryans, arable land was held by family ownership. Later on, during the periods 1200 BC–1200 AD and AD 1540– 1750, the principal unit of land settlement was the village. The British governed the land from 1750 to 1947. During this period, the Permanent Settlement Regulation was introduced to record all rights in respect of land in order to maintain an up-to-date record of land rights, but this remained unsuccessful. So, such was the beginning of land record digitalisation at different levels in the country, India
Since the country’s independence, there has been an emphasis on the implementation of consecutive Five Year Plans addressing agriculture and related economic activities. Moreover, in India, about 58.40 per cent of the labour force is employed in agriculture and allied activities for their livelihood in 2001. Land accounts for more than 50.12 per cent of the total assets of rural households. India is one of the world’s rapidly developing and emerging economies. There has been a continuous decline in the share of agriculture and allied sectors in its gross domestic product (GDP), from 14.60 per cent in 2009–2010 to 13.90 per cent in 2013–2014 (at 2004–2005 prices), which is an expected outcome for a fast-growing and structurally changing economy.
There are a number of strategic issues in land governance and development under different plans and policies. The main objective of land reform is to provide social justice for the people, particularly the cultivators, land owners, landless labourers, and rural populations. The main directives of land reforms are the abolition of intermediaries; land tenancy reforms; rent control reforms; ceilings on land holdings; consolidation of land holdings; security of land holdings tenure; reversal of forced evictions and relocations; women’s land and property rights; and computerisation of land records. In addition to this, land digitalisation process is strengthened and speed-up with establishment of Village Resource Centre’s (VRCs) for cadastral mapping and its connection with other services with the remote sensing satellite communication facilities provided by the National Remote Sensing Centre of the Department of Space of the Govt. of India.
In lieu of this, with the implementation of the land reform program, a certain specified limit of land belonging to landlords was set, and the rest would be taken over by the state. The ceiling on land holdings is an effective measure for land redistribution. In view of the prevailing social and political contexts, the ceiling law was neither politically expeditious nor administratively easy to implement. Kerala and West Bengal States, where rigorous implementation of tenancy legislation took place, have been successful role models of tenancy reforms for the country, India. Land reforms are connected with the right to life and livelihood of a huge rural population. The government is obliged to protect farmers’ land rights. The real threat to India’s wellbeing and security is the displacement of its rural population from its roots. As long as the population is tied to the soil, there will be an increase in agricultural production and economic growth. Farming by smallholders continues to have a direct impact on poverty. More equal distribution of land to this group is viable, and the broad support base of redistribution should significantly raise productivity and improve the livelihoods of the poorest people.
In this context, the chronological analysis of the past 11 Five Year Plans makes it clear that, since the inception of the Planning Commission, industrialisation has been equated with development. The agricultural sector has always been a secondary priority in different plans. It must be noted that a majority of people living in rural areas have remained untouched by the trickledown effect of industrialisation. Due to land reforms, a middle-level peasantry sharing the characteristics of capitalist farmers emerged, who were largely responsible for the green revolution of the 1970s and the 1980s. Today, decreasing sizes of farm holdings are a major challenge to their economic viability.
Consequently, the land reform has been focal point of the country’s political and economic agenda. This also lays a sound foundation for growth, to enable India to compete in the global market. Land reform policy is fundamentally a politicoeconomic issue, and in most cases it is the result of a people’s movement. Land reform means the distribution of surplus land to small farmers and landless cultivators. It has been a major instrument of social transformation, especially in an economy based on feudal and semi-feudal production relationships. The long-term solution is to reduce the dependence of the rural population on land through the expansion of non-agricultural activities.
So, the future growth must be based on higher efficiency and will require to invest in science and new technologies to harness natural land resources, optimise their economic structures for allocative efficiency, and reform their fiscal, financial, banking, and insurance systems which is only feasible through the geospatial digitalisation as continuing by the VRCs centers developed by the NRSC, govt. of India. Thus, the lessons learned from the experiences of India will also help other developing countries and in the global fight against hunger and poverty. So, the longterm solution is to lessen the dependence of rural population on land by the expansion of non-agricultural activities. Nevertheless, the grass root level change in rural society is primarily possible through the agricultural development in which the agrarian reforms have a greater role in fundamental development of the country, India.
References
MoA (2001) Agricultural Statistics at a Glance (2001-2004), Directorate of Economics and Statistics, Ministry of Agriculture, New Delhi.
MoA (2005, 11, 12, 13, 14) Annual Report 2004-05, 2010-11, 2011-12, 2012-13, 2013-14, Department of Agriculture & Co-Operation, Ministry of Agriculture, Government of India, Krishi Bhawan, New Delhi.
MoA (2014) Agricultural Census 2010- 11: All India Report on Number and Area of Operational Holdings, New Delhi, Agriculture Census Division, Department of Agriculture & Co-Operation, Ministry of Agriculture, Government of India.
MoA (2014) Land Use Statistics at a Glance: 2002-03 to 2011-12, Directorate of Economics and Statistics, Department of Agriculture & Co- Operation, Ministry of Agriculture, Government of India, New Delhi.
Raj, K. N. (1975) “Agricultural Development and Distribution of Land Holdings”, Indian Journal of Economics, Vol. XXXI, No. 1.
URL: World Wide Web Resources: http:// iipa.org.in/ ; http://planningcommission. nic.in/ ; http://planningcommission. nic.in/ ; http://rural.nic.in/ ; http:// www.agricoop.nic.in/ ; http://www. censusindia.gov.in/ ; http://www. moef.nic.in/ ; http://www.nrsc. gov.in/ ; http://www.worldbank. org/ ; http://www.yojana.gov.in/
The paper was presented at FIG working 2017, Helsinki, Finland, May 29-June 2, 2017.


 (No Ratings Yet)


Leave your response!