| GNSS | |
Do more satellites lead to a better integrity performance?
This paper employs the question whether simply using all satellites in view at user location mandatorily leads to the optimum integrity performance. This will be demonstrated for the EGNOS integrity concept |
 |
|
 |
|
As more GNSS satellites will be operational within the next few years, the confidence of the position and timing solution for the user is expected to increase. On the other side from the integrity point of view the user faces new problems. It has to protect itself against more potential failures that might occur and hence need to be taken into account. But also considering a single constellation it might not always lead to optimal integrity performance using all GNSS satellites in view of the user. This paper aims at analysing the impact on the size of the vertical as well as the horizontal protection levels based on all satellites in view on the one hand and an optimal subset solution on the other hand by means of a defined statistical value. This issue will be assessed based on the SBAS integrity concept at the example of EGNOS.
SBAS
This section provides an overview of Satellite-Based Augmentation system and in particular European Geostationary Navigation Overlay Service (EGNOS).

Overview
The SBAS is basically the wide-area differential GPS (WADGPS) service effective for numerous users within a continental service area. In order to achieve seamless service area independent of the baseline distance between user location and monitor (or reference station), the WADGPS service provides vector correction information, consisting of separate corrections such as satellite clock, satellite orbit and in case of a single frequency user ionospheric propagation delay as well. In the case of vector correction, the pseudorange correction is separated into components representing different error sources. User receivers can compute the effective corrections as functions of user location.
SBAS relies on a network of ground reference stations distributed over a wide area. Differential corrections that take into account spatially correlated error contributions within a specified area, are calculated and sent to the user via geostationary satellites. Beside SBAS is able to provide integrity information to the user. Finally, the geostationary satellites also transmit a ranging navigational signal similar to the GPS satellites. However, the GEO ranging option is currently only available for WAAS [3].
EGNOS
European Geostationary Navigation Overlay Service (EGNOS) is a pan European Differential GPS system emitting the correction data via Geostationary Satellites. The EGNOS system has four distinct segments: a Ground Segment, a Space Segment, a User Segment and a Support Segment (see Figure 1).
The Ground Segment is the realtime part of EGNOS. It computes precise differential corrections together with the according integrity parameters and makes all of this information available to users through a broadcast by the Space Segment. The Space Segment, using Geo satellites, provides redundant data transmission channels to broadcast to EGNOS users messages containing differential corrections with the associated integrity information.
The User Segment is made of EGNOS receivers that enable their users to accurately compute their position.
The Support Segment contains the following off-line facilities: a Performance Assessment and Check-out Facility (PACF), which provides support for EGNOS operations in such areas as performances analysis, troubleshooting, operational procedures and support to maintenance. The next off-line facility is the so called Application-Specific Qualification Facility (ASQF) which provides civil-aviation and aeronauticalcertification authorities with the tools to qualify, validate and certify the different EGNOS applications. The Development and Verification Platform (DVP) is used to validate and verify EGNOS requirements during the design phase. It contains simulation facilities, a real-time testbed and an assembly, integration and verification platform [1].
The observations from the GNSS are collected at the Ranging and Integrity Monitoring Stations (RIMS) and are sent via the EGNOS wide area network (EWAN) to the Master Control Centres (MCC). In the MCC the user correction data as well as the according integrity information is processed and sent to the Navigation and Land Earth Station (NLES) where the information is linked up to the Geosynchronous Earth Orbit Satellites (GEO) for distribution to the users throughout the service area.
Hence EGNOS provides the user with correction and integrity data for the GNSS. It protects the user from Misleading Information (MI) and Hazardous Misleading Information (HMI) such as faulty range measurements within the specified Time-To-Alert (TTA) of 6 seconds. This applies mainly for the aviation where safety critical applications demand a need for GPS integrity. Until now the EGNOS signal is certified for system integrity and in use since March 2011. For further information refer to [1].
SBAS user integrity concept
The SBAS integrity service should protect the user from failures of GPS by detecting and excluding faulty satellites through the measurements of GPS signals within the network of reference ground stations. Also the user should be protected from transmission of erroneous or inaccurate differential corrections. These erroneous corrections may in turn be induced by either undetected failures in the ground segment or processing of reference data corrupted by the noise induced by the measurement and algorithmic process. This last type of failure, which may occur when the system is in a nominal state meaning no satellite failure, no ground segment or user equipment failure is occurring, is usually known as the “faultfree case”. Protection of the user against noise effects has proved quite demanding during the process of definition and validation of the ICAO SBAS integrity concept. In fact, the potential for such non-integrity events generated in faultfree conditions is inherent to data measurement and processing, to provide users with basic and precise correction messages, and is thus a permanent risk which has to be carefully managed. This has involved the definition of statistical error bounds called horizontal and vertical protection levels (HPL and VPL).
The SBAS integrity concept is published in the GNSS Standards and Recommended Practices (SARPs), published in November 2002. There it is recommended that the equipment shall use the following equations for computing the protection levels. The following equations are applied to calculate the VPL for the user’s position. They are taken from [2]. Although the computation of VPL is described in the following exclusively, the HPL are calculated in an analogous way.
The variance of model distribution that overbounds the true error distribution in the vertical axis is described as following:

The models are further described
in [2]. This information is fed to
the SBAS integrity equation.
The VPL is then computed using the
above variance of model distribution
and a value for KV being consistent
with certain assumptions on the
distribution of position error and on
error correlation time satisfying the
integrity requirement respectively [2].

Simulation
The simulation is performed via the “System Volume Simulator” from Astrium GmbH extended with functions that are necessary to run the analysis. First the assumptions on which the simulations are based on are listed. Moreover an overview of the strategy is depicted how to derive a statement of whether the all-in-view or a dedicated subset solution leads to optimal integrity performance is depicted.
Assumptions
The following assumptions are applied:
• The service area is ECAC and ENP
• Single- and Dual-Frequency user
• A GPS constellation of 24nsatellites plus GEO ranging(in a second scenario)
• The evaluation period here is one day
with a sampling rate of 30 seconds.
• A regular grid with a distance of 1 degree in latitude and a position dependant sampling for the longitude is used to define the user locations [2].
Performance assessment
The idea is to assess the difference in the integrity performance using all satellites and all possible subsets of satellites in view at user location. Therefore the HPLs and VPLs of both using all satellites in view at each user side and all possible subset solutions is being calculated. The number of subsets is given by

With n the total number of satellites in view and k the number of satellites used to form the subsets respectively. Using a single constellation the number of unknown parameters m to be estimated for a general least squares position solution is 4. Hence a minimum of m satellites in view is required. Here it can be seen that the number of all combinations is a function of the number of satellites in view. For example having 10 satellites available would lead to 210 possible subset combinations.
Out of all possible subsets the subset is chosen with the smallest VPL (and HPL respectively) and declared as the optimal subset solution. The optimal subset solution is then compared to the VPL (and HPL respectively) derived from the respective all-in-view solution.
Both the availability either for the all-inview (AIV) case and best subset solution case (BSS) is calculated. A solution is available if the HPL and the VPL is smaller than the respective Horizontal and Vertical Alert Limits (HAL, VAL).

For the BSS Case the smallest HPLs and VPLs either from the AIV or BSS case are compared to the respective Alert Limits.

Finally, the difference between both results for the availability is calculated. A positive difference means that the AIV solution leads to smaller Protection Levels whereas a negative difference means that the BSS is the optimal solution.

The difference in availability for each user location in the service area is then used as the parameter to be evaluated in order to decide whether the AIV or BSS leads to optimal integrity performance.
Results
This section shows the results of the analyses. The figures show the difference in integrity availability of both the protection levels derived from the all-inview (AIV) and the best-subset-solution (BSS) compared to both the LPV-200 (HAL/VAL=40/35m) and the APV-I (HAL/VAL=40/50m) requirement.
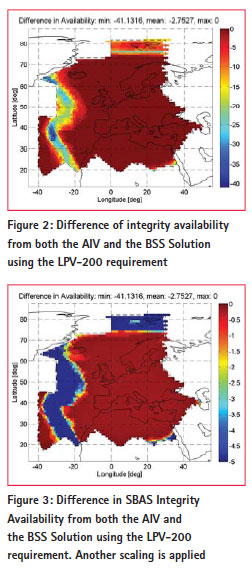
In Figure 2 the difference of integrity availability from both the AIV and the BSS using the LPV-200 requirement is shown for the service area. For this scenario the Geo ranging option is used. In the center of the service area the difference of integrity availability is zero meaning that the AIV solution leads to the optimal integrity performance. Nevertheless some areas show that the BSS leads to up to ~40% higher integrity availabilty than the AIV solution. It is obvious that these areas concentrate more at the borders of the service area.
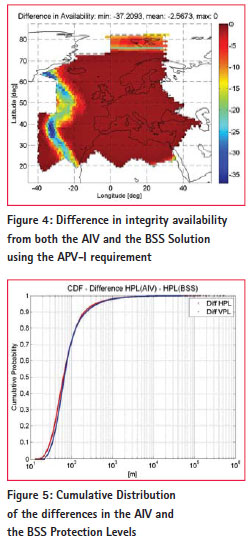
Figure 3 reveals the same results but is displayed with a different scale factor for the difference of integrity availability. In doing so highlights the smaller values for the difference of integrity availability and hence reveals an increase in integrity availability for even more areas using the BSS. The differences of integrity availability shown in Figure 4 are based on another set of requirements (APV-I). Here it also can be seen that the AIV solution does not mandatorily lead to the optimum results. In the border areas it can be observed that a subset solution reveals up to 35% higher integrity availability using the BSS than the AIV solution.
Table 1 summarizes the results of the performance analyses. It can be clearly stated that for a dual frequency user the AIV solution leads to optimal integrity performance. Whereas computing integrity performance using the BSS instead of the AIV increases availability for both scenarios up to around 3% mean for the whole service area. However, locally an increase in availability up to 40% can be observed. These results lead to the strong suspicion that the contribution of the ionosphere causes this effect. In some areas there might be conditions under which a reliable estimation of the ionospheric error contribution to the integrity equation is not possible. This might cause conservative ionospheric estimations leading to degraded integrity performance. This will need to be further investigated.
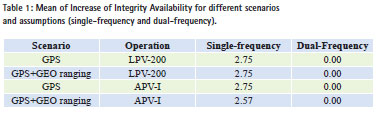
Figure 5 shows the cumulative distribution of all the Horizontal and Vertical Protection Levels from the BSS being smaller than the ones derived for AIV solution. It can be stated that around 75% of these differences remain below 100 meters. Around 0.1% is higher than 1000 meters. Obviously these errors come from insufficient estimations for the ionosphere.
Conclusion
Performance analyses have been performed in order to evaluate under which conditions the optimal integrity performance can be achieved. The focus of these analyses is the number of satellites used for deriving the Protection Levels. Therefore the integrity performance using all satellites in view and all possible subsets of satellites have been compared.
Based on the analyses it can be clearly stated that using all satellites available at the user side does not always lead to optimal integrity performance. Especially in the border areas it can be observed that the all-in-view solution is much worse than the solution coming from the optimal subset. It is observed that in some locations an increase of integrity availability up to 40% can be achieved using the best subset solution instead of all satellites. However, this effect can only be observed for single-frequency users. For a dual-frequency user the performance analyses show that there is no benefit for the users in terms of integrity performance using an optimal subset solution.
A feasible explanation is that error contributions for remote satellites cannot be estimated with high accuracy. Remote satellites are not seen by many RIMS stations which lead to a poor estimation especially of the ionospheric error contribution of that satellite. This assumption is supported by the fact that the areas in which the optimal subset solution leads to better results the number of RIMS stations is poor. In the western part of the evaluation area this is simply due to ocean. However in the northern and south-eastern part of the evaluation area there is a potential to counteract by considering an optimized arrangement of the RIMS stations.
In the northern part there arises also the problem that the number of visible satellites is strongly impacted by the ionospheric grid mask. If satellites are excluded from the position solution the remaining geometry could be improved as the weight of a satellite more to the south is increased. In addition to that the number of Ionospheric Pierce Points (IPP) is limited in the northern region which decreases the quality of the dete rmination of the Ionospheric Grid Points (IGP).
The south-eastern effect could be due to the dimensioning of the RIMS network as there are no RIMS outside the area in this direction. This could be improved with an evolution of the RIMS network dimensioning considering this point.
The outcome of the assessment performed in this paper is to demonstrate that simply using all satellites that are available in sight of the user does not always lead to optimal integrity performance. However as hundreds of subset combinations are possible depending on the number of satellites available it is deemed that a very high computational load is needed at user side. To avoid computing all possible subset combinations an intelligent selection of the subsets that are taken into account can be chosen.
References
[1] European Space Agency, ‘The European Geostationary Navigation Overlay System – A cornerstone of Galileo’, ESA Publications Division, 2006
[2] RTCA, ‘Minimum Operational Performance Standards for Global Positioning System/Wide Area Augmentation System Airborne Equipment’, RTCA DO-229D, 2006
[3] Pullen S. et al, ‘System Overview, Recent Developments, and Future Outlook for WAAS and LAAS’, Department of Aeronautics and Astronautics, Stanford University


 (8 votes, average: 4.63 out of 5)


Leave your response!