| Applications | |
Development of advanced earthquake prediction method using artificial intelligence
The authors spent two years research on the application of the (Mahalanobis-Taguchi Method) MT method for earthquake prediction which shows interesting result |
 |
|
 |
|
JESEA (Japan Earthquake Science Exploration Agency), which celebrated its fifth anniversary since establishment in January 2013, continues to provide mail magazines and web services of “Weekly MEGA Earthquake Prediction” to about 50,000 subscribers in Japan. The prediction method is based on the three-dimensional analysis of daily GNSS data recorded at about 1,300 CORSs which have been constructed by Geospatial Information Authority of Japanese Government as well as 18 CORSs constructed by JESEA (MURAI, S. and ARAKI, H.: 2014, 2015, 2016).
Since the beginning, JESEA has been aiming to predict earthquakes larger than Japanese seismic intensity Level 5. From the commencing date of the business service in February 2013 to the end of 2017, 45 earthquakes larger than Level 5 occurred in Japan. The correctness of the prediction has been 53.3% for ‘acceptable’ status, 37.8% for ‘most likely acceptable’ status and 8.9% for ‘unpredicted’ status. As correctness depends on JESEA’s definition of ‘acceptable’ status, which is within three months of JESEA’s public announcement that an earthquake larger than Level 5 might occur in certain areas and when, it should be traceable to published documents or TV broadcasts. Most likely acceptable status is defined as the predicted time of occurrence of the earthquake within 6 months of actual occurrence. To predict exactly when an earthquake may occur is still a big issue for the earthquake prediction.
Recently, in order to improve the prediction correctness, JESEA has developed a new method using Mahalanobis-Taguchi Method (hereinafter called MT Method) which is considered as one of artificial intelligence methods in the field of Quality Engineering of industrial products. The MT method has been developed by the late Dr. Genichi Taguchi who applied Mahalanobis’s distance (hereinafter called MD) from the feature space of a certified product group to a product being tested (TAGUCHI, G., CHOWDHURY, S. and WO, Y., 2001). If the MD exceeds the threshold, the product should be classified as an uncertified product. In the case when the MT method is applied to the prediction of earthquakes, the feature space of normal status for earthquakes of less than Level 2 has been generated from big data of daily GNSS data of 1,300 CORSs from May 2005 to the present year. Every week new data should be checked whether or not the MD for normal feature space exceeds the threshold. The authors spent two years research on the application of the MT method for earthquake prediction which shows interesting result as described below.
Introduction
The MT method varies depending on the selection of input parameters such as the number of reference CORSs, the coverage area, the range of normal time space, the features to be derived from XYZ coordinates. The most important aspect is to determine the optimal input parameters to maximize the correlation between the MD and the occurrence earthquakes larger than Level 5. After many validation tests, the authors have developed so called “μDEQ chart”, where μD refers to the Malanobis’s Distance and EQ refers to earthquake, which shows the risk factor of earthquake occurrence. According to the validation tests using the daily GNSS data from 1300 CORSs for these 13 years (from 2005 to 2017) and the previous earthquakes larger than Level 5, the results seem feasible as described below.
μDEQ chart in case of East Japan Great Earthquake
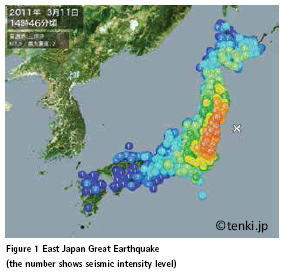
As is well known, the East Japan Great Earthquake occurred on the 11th March 2011 with Magnitude 9.0 and maximum seismic Level 7, which killed almost 20,000 people mainly due to Tsunami (see Figure 1). The epicenter was about 130 km offshore from the Miyagi Prefecture in the Pacific Ocean. According to our validation test with three-dimensional analysis of GNSS data, three major precursors were found 6 months, 5 months and 2 months prior to the earthquake as well as just 3 days prior (see MURAI, S and ARAKI, H, 2011, 2012).
The authors attempted to apply the MT method using the 6 GNSS reference CORS stations (Taneishi, Osako, Chokai, Yamagata-shinjo, Kitaibaragi and Nasu) within the range of 250 km from the most seriously damaged area, 95 days in advance of the earthquake, which is considered normal time period for the likelihood of an earthquake, features derived from X, Y, Z coordinates. We changed many different combinations of input parameters to determine the best correlation between the risk factor of the MD and the occurrence of the previously larger earthquakes.
Figure 2 shows the distribution of 6 GNSS reference stations as well as other GNSS CORSs of Geospatial Information Authority, Japanese Government, in Tohoku Area, in addition to the epicenter of East Japan Great Earthquake. The circle shows the coverage of 250 km.
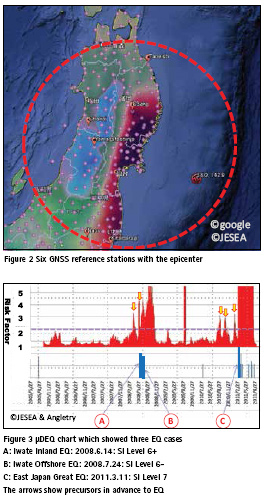
Figure 3 showsμDEQ chart with the time span from the end of May 2005 to the end of August 2011 which includes the East Japan Great Earthquake of March 11, 2011 (called 3.11). The vertical axis shows the risk factor related to the MD with the appropriate threshold. The three thick blue lines in the lower part shows the past three larger earthquakes than Seismic Intensity Level 5 (A: Iwate Inland EQ: 2008.6.14: SI Level 6+, B: Iwate Offshore EQ: 2008.7.24: SI Level 6-, C: East Japan Great EQ: 2011.3.11: SI Level 7). Yellow arrows show the precursors detected in advance of each event. In the case of 3.11, there were three precursors, which coincide with the result of the existing three-dimensional analysis. The size of the aftershocks of 3.11 are identifiable from the large red MD values.
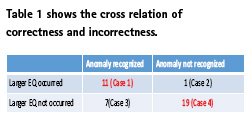
We identified all earthquakes larger than Level 5 within 150 km radius from Sendai City between January 2015 and May 2017 and checked the cross relations as follows;
Case 1: the abnormal risk factor was recognized and an EQ larger than Level 5 occurred within 3 months from the precursor (the prediction was correct).
Case 2: the abnormal risk factor was recognized but an EQ larger than Level 5 did not occur (the prediction was incorrect).
Case 3: the abnormal risk factor was not recognized but an EQ larger than Level 5 occurred within 3 months from the precursor (the prediction was incorrect).
Case 4: the abnormal risk factor for an EQ larger than Level 5 was not recognized and did not occur (the prediction was correct).
μDEQ chart in case of Kumamoto Earthquake
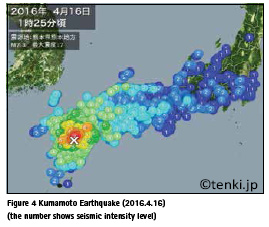
Kumamoto earthquake took place at 1:25 on the 16th April 2016 with M7.3 and SI Level 7 and the epicenter with the depth of 10 km in Kumamoto City, Kyushu Island, Japan (see Figure 4). However, a foreshock occurred at 21:26 on the 14th April 2016 with M6.4 and SI Level 7, which confused most citizens who imagined that a larger earthquake would not take place. This misunderstanding caused more fatalities as many people stayed in their houses which collapsed at the time of the earthquake (MURAI, S and ARAKI, H, 2016).
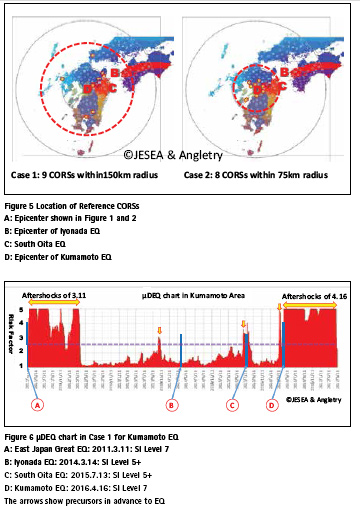
We tried to apply the MT method using different input parameters for validation tests. Out of the validation tests the following three cases are shown below (see Figure 5).
Case 1: 9 reference CORSs within the radius of 150 km.
Case 2: 8 reference CORSs within the radius of 75 km
Case 3: 1 reference CORS at Kumamoto City, close to the epicenter (see Figure 5)
Figure 6 shows μDEQ chart in Case 1 with the relation between abnormal risk factors and the previous larger earthquakes such as the aftershocks of 3.11 East Japan Great Earthquake with the epicenter of aftershocks far from Kyushu Island, Iyonada Earthquake on the 14th March 2014 with M6.2 and SI Level 5+ and South Oita Earthquake on the 13th July 2015 with M5.7 and SI Level 5+. The abnormal precursors in advance of the larger earthquakes can be identified in this figure.
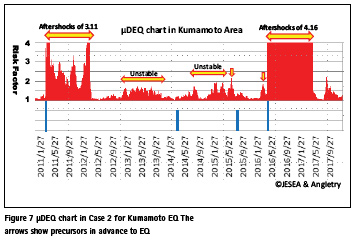
Figure 7 shows μDEQ chart in Case 2 with the precursors in relation of past EQs. Before large EQs, precursors and/or unstable conditions are recognized as shown in the Figure.
The precursor for South Oita EQ and Kumamoto EQ were well recognized in the figure, though Iyonada EQ did not show the precursor clearly because the epicenter of Iyonada EQ is outside of the 75 km radius. However, before the Iyonada EQ, unstable conditions are recognized in the Figure.
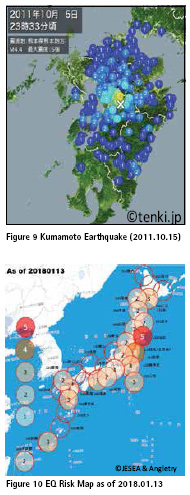
Figure 8 shows μDEQ chart in Case 3 with the precursors in relation of the past two Kumamoto EQs which occurred on the 2011.10.5 with M4.4, SI Level 5+ and on the 2016.4.16 (M6.4 and SI Level 7). The first EQ was very local having hit just Kumamoto City Area shown in Figure 9. The precursor of the first local EQ was only recognized clearly in Case 3.
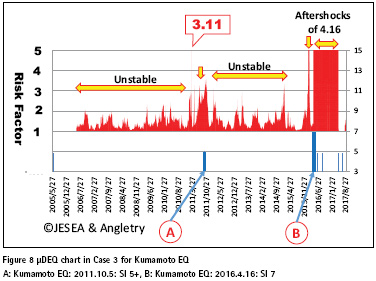
Case studies show that the selection of reference CORSs influences the coverage of the prediction.
Prediction map with risk intensity
After a number of validation tests using the MT method, the authors succeeded to make a prediction map of Japan with risk intensity ranging from 1 to 5 for 30 separate areas with two reference CORSs. Figure 10 shows an example as of January 13 2018. The level 5 shows the highest risk area. The analysis time was around 4 or 5 hours in total depending on the input parameters.
Conclusions
The MT method will be feasible to achieve precise prediction of larger earthquakes if big CORS daily data of more than ten years are provided. However, it is necessary to determine the optimal combination of input parameters to maximize the correlation between the risk factors resulted from the MT method and previous larger earthquakes.
It would be feasible to divide Japan into smaller regions than the large areas used in applying the MT method, because the reference CORSs show similar behavior with high variations, which make the MT method more efficient, as well as reducing computation time. The establishment of reliable prediction of large earthquakes based on the MT method will take time.
Correctness of prediction can be assured by comparisons with the results of the so far successful existing 3D analysis.
Acknowledgment
The authors thank Mr Toshihiro Kitta, President of JESEA for his warm support of the research. The authors appreciate Prof John Trinder for his kind editing the English paper.
References
[1] TAGUCHI, G., CHOWDHURY, S. and WO, Y.: The Mahalanobis-Taguchi System, McGraw-Hill, 2001
[2] MURAI, S. and ARAKI, H.: Prediction of earthquakes and volcanic eruptions using GNSS data (Japanese): 2003, Technical report, Journal of Surveying, Japan Association of Surveyors
[3] MURAI, S. and ARAKI, H.: Earthquake Prediction using GPS, GIM International, Volume 17, No. 10, October 2003
[4] MURAI, S. and ARAKI, H.: Prediction of Earthquake and Volcanic Eruption using GPS: Asian Journal of Geoinformatics, Vol. 4, No.3, March 2004
[5] MURAI, S. and ARAKI, H.: Was early warning of Sumatra earthquake possible? Coordinates, Volume 1, Issue 2, 2005.7, p.8-11
[6] MURAI, S. : Report on Tohoku Kanto Great Earthquake and Tsunami 311: ISPRS Highlights, April 2011
[7] MURAI, S. and ARAKI, H.: Crustal Movement before and after the Great East Japan Earthquake, Coordinates, May Issue 2012
[8] MURAI, S. and ARAKI, H.: Prediction of earthquakes with GNSS data, Volume X, Coordinates, May Issue 2014
[9] MURAI, S. ARAKI, H: Overview for the prediction of larger earthquakes in Japan, Volume XI, Coordinates, July Issue 2015
[10] MURAI, S. ARAKI, H: The Prediction and Validation of Kumamoto Earthquake, Volume XII, Coordinates, July Issue 2016.


 (No Ratings Yet)


Leave your response!