|
The main focus of this paper is the spectral and spatial characterization of GNSS jammers with specific emphasis on multi-frequency wideband jammers which are able to simultaneously jam up to three frequencies. The paper extends previous analysis to jammers also operating in the L2 and L5 bands
|
|
 |
Daniele Borio
|
Post-doctoral researcher,
|
Joint Research Centre,
|
Institute for the Protection and Security of the Citizen,
|
European Commission
|
|
|
 |
Joaquim Fortuny-Guasch
|
Senior Scientific Officer,
|
Joint Research Centre,
|
Institute for the Protection and Security of the Citizen,
|
European Commission
|
|
|
 |
Cillian O’Driscoll
|
Post-doctoral researcher,
|
Joint Research Centre,
|
Institute for the Protection and Security of the Citizen,
|
European Commission
|
|
Global Navigation Satellite Systems (GNSSs) are able to provide precise location and timing information which � nd use in several applications. The usage of GNSSs is not limited to personal and car navigation but, for example, they can be employed for the tracking of goods and animals, to locate trains, navigate ships and for sport applications. In addition to this, precise synchronization can be achieved using relatively cheap Global Positioning System (GPS) clocks: telecommunication networks can be precisely synchronized using the common time scale provided by a GNSS.
In addition to this, new GNSS applications are currently under development or consolidation. For example, GPS boxes can be used by insurance companies to monitor the behaviour of a driver and adjust the insurance premium accordingly. GPS and GNSSs in general enable ‘pay-asyou- drive’ applications which also require the monitoring of the user behaviour. This type of application inevitably introduces privacy issues since GNSSs are used to collect information on GNSS users. This motivates the development and use of devices which can deny GNSS signal reception (Pullen and Gao, 2012).
GNSS jammers are small portable devices able to broadcast disruptive signals in the GNSS bands. A jammer can overpower the much weaker GNSS signals and disrupt GNSS-based services in a geographical area with a radius of several kilometres (Mitch et al., 2011). Despite the fact that the use of such devices is illegal in most countries, jammers can be easily purchased on the internet and their rapid diffusion is becoming a serious threat to satellite navigation.
Clear examples of the risks associated with the usage of GNSS were recently reported in the international press (The Economist, 2011). The case of a truck driver periodically passing close to the Newark Liberty International Airport is described by The Economist (2011). The driver was using a GNSS jammer (or so-called Personal Privacy Device (PPD)) to prevent his company from tracking his position. The jammer was however so powerful that problems were caused to the reception of Wide Area Augmentation System (WAAS) and GNSS signals. Eventually, after three months of investigation, the authorities were able to identify the problem, locate the jammer and � ne the truck driver.
From this discussion, it emerges that GNSS jammers are expected to become a serious threat for GNSS operations and countermeasures should be developed to reduce the associated risks. A proper characterization of jamming signals has been recognized as the first step towards the development of appropriate jamming countermeasures (Mitch et al., 2011). Only accurate jamming signal models enable the design of effective detection, mitigation and location strategies.
The main focus of this paper is thus the spectral and spatial characterization of GNSS jammers with specific emphasis on multi-frequency wideband jammers which are able to simultaneously jam up to three frequencies. The paper extends previous analysis to jammers also operating in the L2 and L5 bands. The characterization of the signals emitted by GNSS jammers was performed in terms of signal spectral features and spatial propagation. The signals transmitted by jammers are frequency modulated chirps which span one or more bands centred on the GNSS frequencies. For each jammer, parameters such as the sweep period, the maximum and minimum swept frequencies and the transmitted power were determined. The spatial characteristics of jammer signals have also been analysed. In particular, it is recognized that the majority of the GNSS denial events reported in the literature originated from in-car jammers. Thus, the effect of the vehicle in which the jammer is located should be taken into account. For this reason, the spatial distribution of the power transmitted by a jammer was analysed accounting for the vehicle presence. The analysis was repeated for two different vehicles: a small car (Fiat Panda) and a van (Fiat Ducato). From the analysis, it emerges that the structure of the vehicle favours speci� c propagation directions, usually corresponding to the windows. This type of analysis can be useful for the design of sophisticated jammer detection/location algorithms.
Multi-frequency jammer characterization
In this section, the spectral characteristics of 7 GNSS jammers are described. The jammers used for the analysis were provided by Nottingham Scienti� c Ltd. (NSL), the coordinator of the FP7 project DETECTOR (http://www.gnss-detector. eu/) which focuses on the “detection, evaluation and characterization of threats to road applications”. NSL kindly made the jammers available to the JRC for the tests reported on herein.

The jammers used for the analysis were labeled from 1 to 7 and can be classified as follows. Jammers 1 and 2 belong to group 2 (SMA-battery jammers) of the classification proposed by Mitch et al. (2011) whereas jammers from 4 to 7 are cigarette lighter jammers (group 1). Jammer 3 requires an external 12 Volt power supply and although it came without a dedicated connection for the cigarette lighter it can be powered in this way. All the jammers transmit a single saw-tooth chirp signal and thus belong to class 1 of the classification suggested by Kraus et al. (2011). The tests were conducted inside the JRC anechoic chamber where it is possible to transmit signals without interfering with other systems. The jammer under test was mounted on a tripod and used to transmit the jamming signal which was received by a calibrated double ridge horn antenna. The receiving antenna was connected to a Tektronix RSA6114a, a wideband real-time spectrum analyzer able to collect Inphase/ Quadrature (I&Q) samples with a sampling frequency up to 150 MHz. Several short datasets of 1 ms duration were collected and used for the characterization of the jamming signals. A Rohde & Schwarz (RS) SMB100A RF and microwave signal generator was used to calibrate the transmission chain and determine the calibration factors used to measure the absolute power transmitted by each jammer.
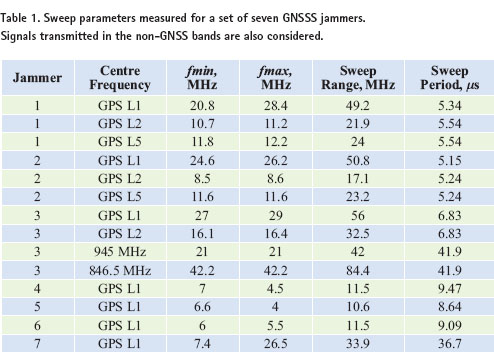
The analysis of the jammers follows the approach employed by Mitch et al. (2011) and provides the sweep and power parameters of the signals emitted by the devices considered. The sweep parameters of the 7 jammers are provided in Table 1 which also considers signals transmitted in non- GNSS bands. A signi� cant variability among the sweep parameters is observed: for example, the sweep period in the L1 band varies from about 5 to 37 μs. This variability is observable not only among jammers of different models but also among devices of the same type. This phenomenon is consistent with the results discussed by Mitch et al. (2011).
Non-cigarette lighter jammers (J01, J02 and J03) are able to jam very wide frequency ranges (about 50 MHz) in the L1 frequency. In this case, the military P(Y) and Galileo Public Regulated Service (PRS) signals will also be severely affected.

Figure 1. Spectrogram of the signals transmitted by jammer J02 in the GNSS L2 and L5 bands.
Multi-frequency jammers transmit signals characterized by the same sweep period in each frequency band. This indicates that a single local oscillator is used for the generation of all the signals. Consider for example, jammer J01: the sweep period for the L1 signals is about 5.34 μs whereas for the L2 and L5 components is 5.54 μs. The difference between the two periods is explained by the fact that two different datasets were used for the analysis. The jammer local clock is affected by biases and drifts which explain the variability between measurements taken at different times. Since the spectrum analyzer used for the analysis is able to capture an instantaneous bandwidth of about 150 MHz, it was possible to jointly collect signals in the L2 and L5 bands. The spectrogram of the signals transmitted by jammer J02 in L2 and L5 is shown in Figure 1. The L2 and L5 jamming signals have a similar pattern although the L5 component is more powerful and spans a larger frequency range. The two signals have the same sweep period even if there is a relatively small offset between the instants at which a frequency reset occurs. Signals transmitted in non-GNSS bands are characterized by much slower sweep periods. In particular, the signals transmitted in the GSM bands by jammer J03 are characterized by sweep periods about six times slower than those of the signals emitted in the GNSS frequencies.

The results obtained are combined with those of (Mitch et al., 2011) in Figure 2 which provides some indication of the distribution of the sweep periods of jammers available on the market. From the figure, it emerges that cigarette lighter jammers currently operate only in the L1 frequency. Moreover most of these jammers have a sweep period of about 9 μs even if signi� cant deviations can be found. This is the case of jammer J07 which has a sweep period equal to 36.7 μs. When considering the totality of the jammers, it clearly emerges that 9 μs is the most common value for the sweep period. In Figure 2, jammer J03 is considered separately given its architecture and power consumption.
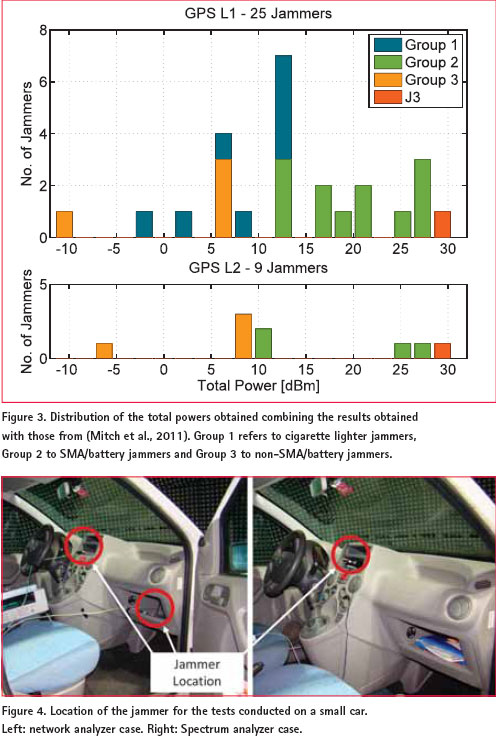
The power parameters measured for the 7 jammers are analyzed in Figure 3 along with the � ndings obtained by Mitch et al. (2011). The total transmitted power varies depending on the type of jammer and even among jammers of the same type. In general, cigarette lighter jammers are characterized by lower power levels than multi-frequency battery jammers. Moreover, extremely high powers are transmitted in the non-GNSS bands.
Jammer spatial characterization
Most jammer events detected “in the wild” have arisen from low-cost invehicle jammers. For this reason, several tests were performed in the JRC anechoic chamber with the final goal of investigating the impact of the vehicle type and antenna location on the jamming signal.
Two types of tests were conducted:
• Network analyzer based tests: the JRC anechoic chamber is equipped with a Vector Network Analyzer (VNA) which allows one to characterize an RF channel as a function of the azimuth and elevation of the receive antenna. In this case, the jammer is replaced by a signal source emitting signals with known properties, i.e. CW signals with known power. The measurements with the VNA were conducted using three monopole antennas (those that came with jammers 4, 5, and 6) and a 3-port electromechanical RF switch. At each receiver position (azimuth and elevation), the RF channel associated with each of the three monopole antennas was measured. The total measurement procedure over all azimuth and elevation angles took a total of just over 9 hours.

• Spectrum analyzer based tests: measurements with a real jammer placed inside a vehicle were conducted. In this case, the Tektronix spectrum analyzer mentioned above was connected to the probe antenna placed on one of the sleds of the anechoic chamber. The JRC anechoic chamber is equipped with two sleds allowing one to scan different elevation angles.
An example of a measurement setup using the network and spectrum analyzer is shown in Figure 4. In this case, a small car, a Fiat Panda, was placed inside the anechoic chamber and three different jammer locations were considered for the network analyzer case (left part o f Figure 4). In the spectrum analyzer case, a single jammer position was considered.
The three positions considered for the network analyzer tests are:
• the dashboard of the vehicle. This position represents the case of a jammer inserted in the cigarette lighter plug.
• the glove box of the vehicle. This position corresponds to the case of a battery jammer left in the glove box.
• in the boot of the vehicle. Although this is a less realistic location, it was selected because it was expected to provide signi� cantly different results with respect to the previous cases.
For the spectrum analyzer based tests, the following approach was used. At each position of the probe antenna two measurements were performed and I&Q samples were collected for both Right Hand Circular Polarization (RHCP) and Left Hand Circular Polarization (LHCP) polarizations. The length of each dataset collected was 1 ms, and a sampling frequency fs = 150 MHz was used.
Results: Network Analyzer Tests
The calibrated transmission/reception chain of the JRC anechoic chamber was used to determine the composite loss,

given by the loss caused by the vehicle, Lv, the jammer antenna gain and other mismatch losses, Lm. Quantities in (1) are expressed in dB and the same sign convention is used for losses and gains. This implies that negative quantities in (1) imply a reduction of the signal power. Note that the quantities in (1) are a function of the elevation and azimuth of the receive antenna, � and �, respectively. Mismatch losses account, for example, for polarization mismatches between the receive and transmit antennas.
The composite loss, Lc, allows one to determine the impact of a vehicle on the signal transmitted by a jammer as a function of the jammer direction of arrival. In particular, the jammer power received at a distance r can be computed as

where λ is wavelength associated to the received signal centre frequency. Measurements were conducted considering a 5 degree resolution in both the azimuth and elevation domains. Moreover, Lc was obtained by transmitting a CW at a specific frequency. During the tests, the [0.8-2.4] GHz frequency range was swept with a 1 MHz step.The results presented in the following were obtained by averaging the channel losses measured over the 1.570-1.580 GHz frequency range. This range is approximately centered around the GPS L1 centre frequency and has a width comparable to the bandwidths of commercial GNSS receivers.

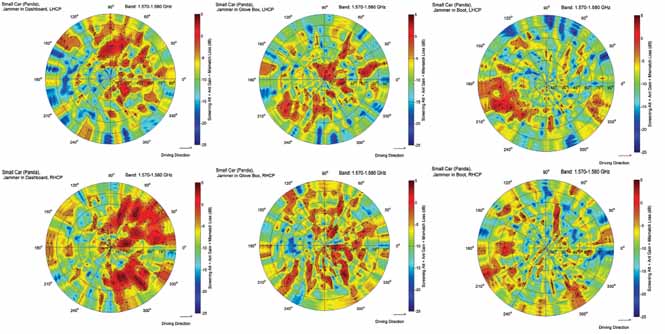
Figure 5. Composite loss accounting for vehicle attenuation, jammer antenna gain and other mismatch losses in the case of a small car (Fiat Panda). The loss was obtained by averaging network analyzer measurements in the 1.570-1.580 GHz frequency range. Different jammer locations and antenna polarizations are considered.

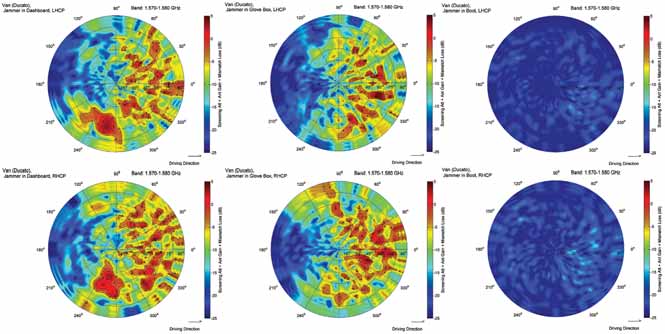
Figure 6. Composite loss accounting for vehicle attenuation, jammer antenna gain and other mismatch losses inthe case of a van (Fiat Ducato). The loss was obtained by averaging network analyzer measurements in the 1.570-1.580 GHz frequency range. Different jammer locations and antenna polarizations are considered.
The results obtained from the network analyzer tests are shown in Figure 5 and Figure 6. From the figures, it emerges that the interaction between the jammer and the vehicle favours speci� c propagation directions. For example, when the jammer is placed in the dashboard, the transmitted signal is amplified when received from directions corresponding to the vehicle windscreen. The glass of the windscreen does not significantly attenuate the signal. On the contrary, directions corresponding to the rear of the car are less favoured. By comparing LHCP and RHCP plots, it emerges that there is not a favoured polarization. When considering the glove box position, no specific propagation direction seems to be favoured in the small car case. When the jammer antenna is placed in this position, the signal emitted interacts with the different elements of the car and several re� ections occur. Moreover, the Fiat Panda has wide windows through which the jammer signal can easily propagate. This phenomenon does not occur for the van. The Fiat Ducato does not have rear windows and the jammer signal can propagate only through the front windows. This effect clearly appears in Figure 6: Lc assumes higher values (in some cases amplification occurs) in correspondence with the front of the vehicle. When the jammer antenna is placed in the rear of the vehicle two situations occur. In the small car case, angles corresponding to the rear windows seem to favour signal propagation. This fact is particularly evident in right part of Figure 5 where Lc assumes positive values in the [150-240] degree azimuth range. The asymmetry in the plot is due to the location of the jammer antenna.
The results obtained for the van are substantially different from those observed during the small car experiments. There are no windows in the rear of the van which essentially behaves as a metal cage. For this reason, the jammer signal is strongly attenuated and Lc assumes values lower than – 15 dB. From these results, it emerges that vehicles equipped with GNSS jammers show clear RF signatures which may be used for identifying the vehicle type.
Results: Spectrum Analyzer Tests
For the spectrum analyzer tests, only the case of a jammer placed in the cigarette lighter of the Fiat Panda was considered. The analysis was limited to one case due to the complexity of the setup and the time required for a single scan: the whole test lasted 7.4 hours.

The total received power is shown in Figure 7 as a function of the direction of arrival (azimuth and elevation angles). The received power is shown in order to provide an indication of the signal strength as seen by a receiver placed at a distance of about 9.5 m from a vehicle equipped with a jammer (the radius of the anechoic chamber is about 9.5 m). Note that the transmit power can be calculated for the received power using (2).The diagrams reported in Figure 7 are in agreement with the results reported for the network analyzer case. In particular, patterns similar to those observed in Figure 5 are found: the jammer power mainly propagates through the windscreen of the car whereas other propagation directions are more attenuated. Differences between Figure 7 and Figure 5 are justi� ed by the different way the received power was measured. The agreement should be however considered satisfactory since both tests clearly show that speci� c propagation directions, which re� ect the structure of the vehicle, are favoured.
Conclusions
In this paper, signals emitted by several GNSS jammers have been analyzed and spectral and spatial characterizations of jamming signals have been provided. From the signal characterization it emerges that jamming signals can sweep large frequency ranges in short time periods. In particular, it was found that the smallest frequency range covered by a jammer is about 10.5 MHz with a sweep period of about 9 μs. The transmitted power varies signi� cantly depending on the jammer type. Combining results from the literature and experimental � ndings, it was shown that the transmitted power can vary from about -10 to more than 30 dBm. This variability is due to the availability of different jammer models. When battery jammers are considered the transmitted power is also impacted by the charge level. Despite the large variability, the power levels measured are extremely high compared to the strength of GNSS signals. For this reason, jammers can create serious problems for GNSS operations in large geographical areas. A spatial characterization of the signals transmitted by jammers was also performed since it has been recognized that most of the jamming events reported in the literature originated from vehicles such as trucks and cars. Thus, the propagation of jamming signals is strongly impacted by the structure of the vehicle which hosts it. The jamming propagation channel was characterized considering the impact of different vehicles and jammer positions. Two vehicles, a small car and a van, were used for the measurements and the attenuation due to the jammer antenna gain pattern and the vehicle structure was determined for different reception angles. From the analysis, it emerges that the structure of the vehicle favours speci� c propagation directions which usually correspond to windows. Metal parts of the vehicle strongly attenuate the jamming signals. Each vehicle has a speci� c RF frequency signature which identi� es the vehicle type and may be used to improve jammer detection and location.
Acknowledgments
The authors would like to express their thanks to the partners of the FP7 project DETECTOR for the support provided in this measurement campaign, in particular for the loan of the jammer used for the tests. Special thanks for the support provided during the measurement campaign are also due to Messrs. Jean- Marc Chareau, Philippe Viaud and Marco Basso, all in Unit G06 of the Institute for the Protection and Security of the Citizen, EC Joint Research Centre.
References
Kraus, T., Bauernfeind R. and Eissfeller B. (2011). Survey of in-car jammers – analysis and modeling of the RF signals and IF samples (suitable for active signal cancelation). Proceedings. of the 24th International Technical Meeting of The Satellite Division of the Institute of Navigation ION/ GNSS, pages 430-435, Portland, OR.
Mitch, R. H., Dougherty, R. C., Psiaki, M. L., Powell, S. P., O’Hanlon, B. W., Bhatti, B. W. and Humphreys T. E. (2011). Signal characteristics of civil GPS jammers. Proceedings of the 24th International Technical Meeting of The Satellite Division of the Institute of Navigation (ION/GNSS), pages 1907-1919, Portland, OR.
Pullen, S. and Gao G. (2012). GNSS jamming in the name of privacy. Inside GNSS, pages 34-43
The Economist (2011). GPS jamming: No jamming tomorrow. Technology Quartely, March. |


 (5.00 out of 5)


 (5.00 out of 5)


 (5.00 out of 5)


 (5.00 out of 5)
Leave your response!