|
Table 5 the processing result of 2005.08.25, 2006.09.21 and 2007.10.21

Table 6 the general result of all kinds of combination

The compare result by adopting the data of 2002
In calculating the data of the year 2002, after the relevant solution, we choose the better data 020711XE.NGS on July 11 to explain the result, the specific calculating result please refer to table2 (I – VI represent various combination of different models, the figures shown in this table represent the value of CHI-SQ):
In the data processing on July 11 2002, we can see that if we choose FORTLEZA and ALGOPARK as the reference station for adjustment, in addition to the first group, the effects of the others are not ideal. When choosing MATERA as the reference station to calculate, all six groups’ precision are not ideal. After removing the results of these three stations, we average the other three stations, and then we get the second group of average.
The compare result by adopting the data of 2003
When we processed the data on October 21 2003, we found that there were a considerable number of observations were reduced their power, and their availability and the results is not very good to deal with. In the final model comparison, we choose not to consider this data. The specific calculating result please refer to table3 (I – VI represent various combination of different models, the figures shown in this table represent the value of CHI-SQ):
The compare result by adopting the data of 2004
In calculating the data of 2004, after the relevant solution, we choose the better data 040601XA.NGS on June 1 to explain the result, the specific calculating result please refer to table4 (I – VI represent various combination of different models, the figures shown in this
table represent the value of CHI-SQ):
In the data processing on June 1 2004, we can see that if we choose TIGOCONC and WESTFORD as the reference station for adjustment, in addition to the

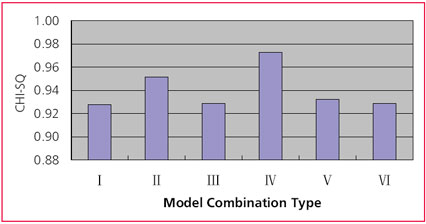
Figure 1 the general result of all kinds of combination
second and sixth group, the effects of the others are not ideal. After removing the results of these two stations, we average the other three stations, and then we get the third group of average.
The result by adopting the data of 2005-2007
Adopting this method, we get the results on August 25 2005, September 21 2006, October 21 2007, the final processing result please refer to table 5 (I – VI represent various combination of different models, the figures shown in this table represent the value of CHI-SQ):
Compared results
After doing these works, we compute the precision of various model combinations, and list the result with table 6: (I – VI represent various combination of different models, the figures in this table represent the value of CHI-SQ): Then we represent the result correspondingly create the figure 1:
From figure 1 and table 6, we can see that in these six kinds of categories, the fourth model of the results of the final classification sought by the CHISQ value is 0.9728, the closest to 1.00. Though the precision of the other combinations is near 1.00 too, their gap is very small. We believe that in the same circumstance, choosing the combination of RAY ocean tide model and IAU_1980 nutation model is the best choice.
Conclusion
On the basis of briefly introducing several common ocean tide models and nutation models, this paper uses the OCCAM 5.0 software platform and the global VLBI data during 2001-2007, compares and analyzes the precision of the geodetic parameter result getting from these models. The final results show that: using RAY ocean tide model and IAU_1980 nutation model, we can obtain the best precision result in this kind of model combination. This paper has done basic work for future data processing and analyzing.
Acknowledgement
This research is funded by the national ‘973 Project’ of China (No 2006CB701301), the national ‘863 Project’ of China (No. 2008AA12Z308) the National Natural Science Foundation of China(No. 40774007), and the project of university education and research of Hubei province (No. 20053039).
Reference
1] O.Titov, V.Tesmer, J.Bohem. OCCAM 5.0 USER’S GUIDE
2] Erhu Wei, Jingnan Liu, Zhenghang Li, Chuang Shi. The simulated computation of estimating geodetic parameters with space VLBI observations. Journal of Wuhan university science edition, 2006,31(10): 875~878
3] ftp://gere.oso.chalmers.se/pub/ hgs/oload/#olcs41.readme#
4] http://www.oso.chalmers. se/%7Eloading/tidemodels.html
5] Zhenghang Li, Debao Xu, Yiying Dong, Caizhang liu. The fundament of space geodetic theory. Wuhan: Mapping Wuhan University of Science and Technology Publishing House,1998
6] Liande Pan. The newly reference system in criterion and the related issues. Shanxi observatory Journal. 2002[25]: 131~140
7] IAU Information Bulletin 88.Resolution B1.6.2001
8] O.Titov, V.Tesmer, J.Bohem. OCCAM 6.2 USER’S GUIDE
9] http://hpiers.obspm.fr/eop-pc/ models/nutations/nut_oceanic.html
10] http://mars.hg.tuwien. ac.at/~vlbi/db2/
|


 (No Ratings Yet)


