| GNSS | |
Trapping the jammer: the Slovenian experiment
This paper provides a comprehensive account of the activities jointly conducted by the European Commission Joint Research Centre, the University of Ljubljana and Agency for Communication and Services of Republic of Slovenia to characterize and ultimately mitigate the jamming threat |
 |
|
 |
|
 |
|
 |
|
 |
|
 |
|
 |
|
 |
|
During the last decade, the number of applications relying on Global Navigation Satellite System (GNSS) has experienced an exponential growth. Nowadays, GNSS positioning is fundamental in different fields including avionics, Location Based Services (LBSs), road and maritime transportation. Moreover, GNSS technologies are key-enabler for several regulated and safety-critical applications, such as the Digital Tachograph (DT), the Automatic Identification System��(AIS) and time distribution infrastructures. Hence, GNSS should provide reliable and continuous services. These services, however, can be easily disrupted by several interference sources including intentional attacks such as spoofing and jamming. Jamming, in particular, is the voluntary emission of powerful electromagnetic waves towards a victim GNSS receiver which will be prevented to operate [1]. Jamming can be perpetrated using low-cost portable devices called jammers. The proliferation of such devices is expected to grow along with the development of GNSS-based services. Possible solutions to address GNSS jamming include jamming detection [2] and jammer localization [3]. This paper presents the joint efforts of the European Commission Joint Research Centre (JRC), of the University of Ljubljana and of the Agency for Communication and Services of Republic of Slovenia (AKOS) towards the development of reliable and affordable techniques for jamming detection and localization. The activities performed have a strong experimental component and two extensive data collections were carried out with the ultimate goal to design effective jamming countermeasures. The principle is similar to that adopted to fine drivers not respecting speed limits: a speed trap is used to identify and fine the law transgressor. In a similar way, “jammer traps” should be developed to allow authorities to reliably identify the presence of jammers on-board vehicles and fine the jammer user. It is noted that the usage of GNSS jammers is considered illegal in most countries and the availability of reliable localization techniques will simplify the operations of authorities trying to stop this phenomenon.
The first data collection was organized in July 2015 and it was followed by a second campaign that took place in November 2015. The second campaign benefited from the experience gained during the experiments conducted in July and several additional tests were designed and performed to evaluate possible jammer localization approaches.
Different experiments were conducted and, in particular, the following approaches were considered:
1. Spectrum monitoring and sentinel receivers: a portable Rhode & Schwarz PR100 spectrum analyser was used to fingerprint the signal broadcast by jammers. A sentinel GPS receiver was also used to assess the impact of jamming on GPS devices.
2. Software Defined Radio (SDR)- based detection: several detection approaches were implemented using the samples provided by a lowcost TV tuner used as agile frontend operating in the GNSS bands.
3. Receiver-based detection: detection techniques based on the measurements provided by a GNSS receiver have been considered. This included the use of C/N0 measurements provided by victim GPS receivers.
4. Jammer localization using C/N0 measurements: two approaches for jammer localization were attempted using a single moving GPS receiver and a grid of static smartphones.
These four types of tests were performed in parallel considering two scenarios: in the first case, a static jammer was used while the detection unit was mounted on a moving vehicle. In the second scenario, the role of jammers and detection units was inverted: the jammer was installed on a moving vehicle while the detection unit was static on the road side. The two scenarios are complementary and provide insights on the effects caused by a jammer.
For jammer localization, a third scenario was also considered where a grid of Android phones was used to simultaneously collect C/N0 measurements. This last type of tests was implemented only during the second data collection.
The two measurement campaigns took place in the proximity of the village of Črnotiče in Slovenia and provided valuable data for the evaluation of the jamming threat. This paper provides an account of the experimental and analysis activities originated from the experiments conducted in Črnotiče. More details on specific aspects of the experiments conducted can be found in the references provided at the end of the paper.
The Slovenian campaigns
The first scenario considered during the two Slovenian campaigns is described in Figure 1. In this case, jammers were kept static whereas the detection unit was mounted on a car as schematically represented in Figure 1 b). The vehicle with the detection units moved, with an almost constant velocity, back and forth between the two way-points (A and B) shown in Figure 1 a). The tests were repeated considering different jammers (three jammers were used) and different speeds (50 and 90 km/h). The measurement units employed included a Realtek RTL2832U front-end, used to collect In-phase/Quadrature (I/Q) samples and implement experiments of type 2, a u-blox LEA-6T, GPS single frequency receiver, used to collect GNSS measurements and implements techniques of type 3 and 4. The Ljubljana Interference Monitor (LIM), a composite detection unit based on a Raspberry Pi platform, a GPS receiver and a RTL2832U front-end was also adopted for testing real-time SDR approaches.
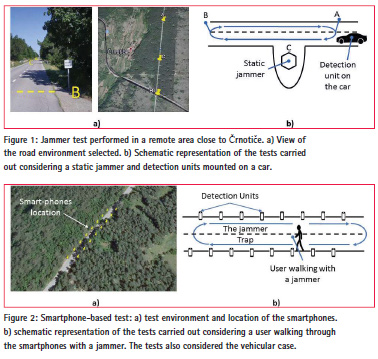
As mentioned above, a second scenario was also performed where the detection unit was static and the jammer was mounted on a vehicle. In this case, a portable Rhode & Schwarz PR100 spectrum analyser was used to fingerprint the jamming signal. The tests performed in the two scenarios provided similar results. The usage of a static jammer however allows one to establish a reference position for the jammer, and thus it allows the performance analysis of jammer localization techniques. For this reason, more emphasis is provided here to the results obtained for the first scenario.
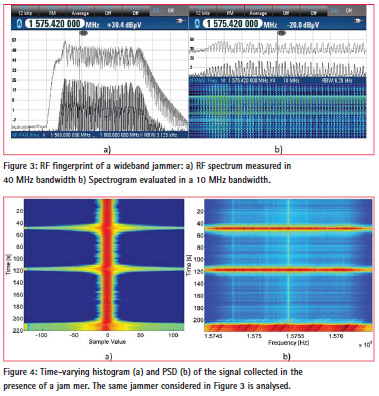
The third scenario developed for the techniques of type 4 is illustrated in Figure 2. In this case, sixteen Android smartphones were placed over a regular grid along a straight section of the road. The location of the phones is shown in Figure 2 along with a schematic representation of the tests performed. A vehicle equipped with a jammer passed several times between the phones at different speeds. Also in this case, the test was repeated considering three different jammers and different speeds. The experiment was also repeated considering a pedestrian user slowly moving through the phones. During the experiments, the phones continuously collected C/N0 measurements which were used for jammer localization.
Trapping the jammer
This section provides a summary of the results obtained for the different techniques tested and for the different scenarios considered.
Spectrum monitoring and sentinel receivers
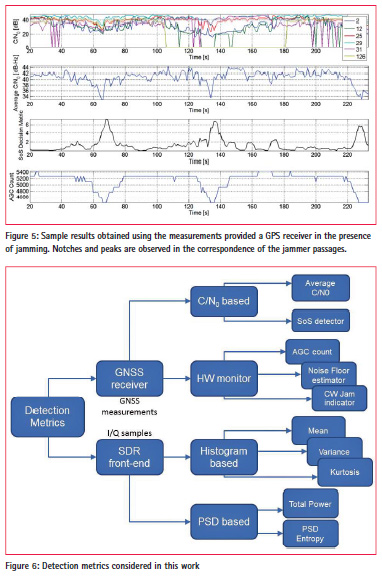
The usage of portable spectrum analysers, such as the Rhode & Schwarz PR100 device, allows one to obtain a clear fingerprint of the signal broadcast by a jammer. This approach not only allows one to detect the jammer presence but it also provides specific signatures which, in principle, can be used to identify the specific jammer type. During the experiments conducted, it was possible to clearly distinguish the three jammers adopted: each device has its Radio Frequency (RF) signature with a characteristic spectral shape. Sample results obtained during the Slovenian campaign are shown in Figure 3 which provides the RF signature of one of the three jammers considered. The jamming signal spans a 32 MHz frequency interval which is significantly larger than the bandwidth of GPS and Galileo open signals.
The data were collected with the equipment positioned on the road side with the jammer placed on a car passing closely to the observation station. The minimum distance between jammer and spectrum analyser was about 5 m. The colour variations in the spectrogram in Figure 3 b) refl ect the received power variations due to the approaching and distancing of the jammer.
SDR-based detection
The availability of the I/Q samples provided by a SDR front-end enables sophisticated detection techniques with performance similar to that achieved using a commercial spectrum analyser . In particular, I/Q samples can be used to compute metrics such as the histogram and the Power Spectral Density (PSD) of the input samples. The histogram and the PSD provide a signature of the jamming signal, and thus enable jammer identification.
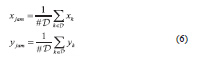
The time-varying histogram and PSD obtained considering the same jammer discussed in the previous section are provided in Figure 4. When the jammer is in the close proximity of the RTL device, the jamming signal saturates the front-end and the input samples assume significant values. This fact is refl ected by the multi-coloured bands present in Figure 4 a). A similar effect can be observed in PSD: when the jammer is closed to detection unit significant power is present in all the frequencies captured by the SDR front-end.
From the histogram and the PSD, it is possible to derive summary statistics which can be used for jamming detection. Metrics derived from the histogram are the signal mean, variance and kurtosis whereas metrics derived from the PSD are the total power and the spectral entropy. Receiver-based detection GNSS receivers provide several measurements which are significantly affected by a jamming signal. C/N0 measurements, for example, refl ect the presence of interference: a significant drop in all C/N0 values is experienced in the presence of jamming. C/N0 values are “naturally” provided by most GNSS receivers and are, for example, directly accessible in smartphones. Thus, jamming detection can be implemented exploiting C/N0 measurements. In addition to C/N0 values, several receivers provide the Automatic Gain Control (AGC) count, a noise fl oor estimator and dedicated interference indicators. All these measurements have been used for jamming detection.
Sample results obtained using receiverbased metrics are provided in Figure 5: the average C/N0 refl ects the reduction in performance caused by the proximity of the jammer. The Sum-of-Squares (SoS) approach suggested by [5] has also been considered: the SoS detection metric clearly refl ects the jammer presence. Finally, Figure 5 shows the AGC count as a function of time: when the car with the jammer passes closely to victim receiver, the AGC count drops significantly, revealing the presence of an interference source.
A summary of all the detection metrics considered in this work, with both SDRand receiver-based techniques is shown in Figure 6. All these techniques have been analysed and compared using the data collected during the Slovenian campaigns. A detailed analysis of these detection approaches can be found in [4].
Note that more complex approaches can be developed by combining the information provided by both SDR platforms and GPS receivers. An example is the LIM platform developed by the University of Ljubljana which integrates different sensors using the Raspberry Pi micro-computer. More details on LIM can be found in [6].
Localization technique
Finally, jammer localization techniques have been implemented using C/N0 measurements. Two approaches, namely synthetic and crowdsourcing localization, have been considered. The two approaches are both based on the usage of C/N0 values: in the first case, measurements are taken by the same device at different locations and at different time instants. In the second case, a grid of Android phones is used to simultaneously collect the C/N0 measurements.
As indicated above, C/N0 estimates are affected by the presence of interference and the C/N0 provided by a receiver can be expressed as [7]:
![]()
where Ci is the power received for the ith satellite, N0 is noise power spectral density and J is the received jamming power. kα is the Spectral Separation Coefficient (SSC) [7] and models the filtering effect of the receiver on the jamming signal. From Eq. (1), it emerges the C/N0 is a function of the received jamming power which can be related to the jammer/receiver distance using a simple path-loss model:
![]()
where J0,dBW is the jammer reference power measured at distance d0. α is the path loss exponent and can be assumed equal to 2 for rural open environments. d is the distance between the jammer and the victim GNSS receiver. Eq. (2) is expressed in logarithmic units. By expressing (1) in logarithmic scale and combining it with (2) it is possible to obtain a simple model valid when the jammer is in the proximity of the victim receiver. In particular,
![]()
where βi is an unknown parameter which absorbs several factors such as the un-interfered C/N0, the SSC and the transmitted jamming power. βi can be obtained through calibration. Synthetic localization is based on
![]()
where C/N0 measurements are combined in a cost function whose minimum corresponds to the location of the jammer. In particular, it is possible to consider C/N0 measurements taken at different time instants and in different positions as equivalent to simultaneous observations from different receivers. In order to obtain more robust measurements, the average C/N0 can be used and (4) can be rewritten as: (4) where notation ‘[n]’ is used to indicate quantities measured at the instant n. In particular, (x[n],y[n]) and d[n] are the receiver position and the receiver distance from the jammer at the instant n. β is the average of the βi terms which refer to a single satellite. Using (4), it is possible to construct the cost function:
![]()
where N is the number of instants during which a jamming event is detected. The jammer position is computed minimizing (5).
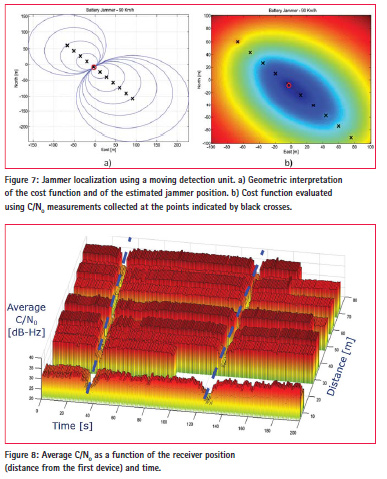
Sample results obtained using the approach described above are shown in Figure 7. A geometric interpretation of the cost function and of the estimated jammer position is provided in Figure 7 a): the jammer is localized at the intersection of different circles. Each circle is centred at the location of the vehicle hosting the detection unit and its radius is defined by the average C/N0 observed.
In Figure 7 b), the cost function is plotted with respect to the estimated jammer location expressed in a local frame centred in the true jammer position. Thus, the coordinates estimated for the jammer correspond to the actual localization error which, in this case, is less than 10 meters. This level of accuracy was consistently observed among the different tests performed. For the crowdsourcing approach, it was not possible to use the same principle described for synthetic localization. In particular, each phone involved in the experiment was characterized by a different β. Since the calibration of all phones was not feasible, a different approach was adopted. C/N0 measurements are first used to detect the jamming presence: jammer localization is then achieved by combining detection results from different smartphones. For localization, it was assumed that GNSS receivers are sufficiently far from the jamming source to obtain a valid position solution and sufficiently close to be affected by the jamming signal and observe a reduction in C/N0. Jamming detection was implemented using the SoS approach mentioned above and the jammer position was finally obtained as
where D is the set of receivers detecting a jammer. #D is the number of receivers detecting the jammer and (xk, yk) is the position of the kth receiver. The jammer location is thus identified as the centroid of the positions of the receivers which detect the jammer. If D is empty, the jammer is not detected and localization is not performed. Sample results obtained using the crowdsourcing approach are presented in Figure 8. Specifically, the average C/N0 is provided as a function of the phone location and time. The average C/N0 describes a “spatial wave” which clearly shows the passages of the jammer. Although few devices malfunctioned, the direction of motion and velocity of the jammer can be easily identified.
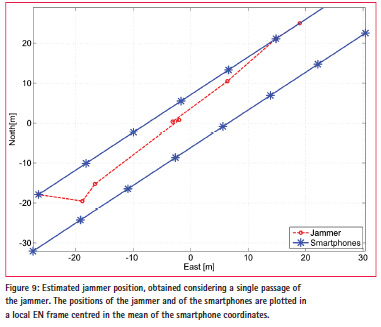
The estimated jammer positions together with the smartphones locations are shown in Figure 9. The red trajectory is the jammer trajectory obtained considering a single passage of the jammer. The positions of the jammer and of the smartphones are plotted in a local East North (EN) frame centred in the mean of the smartphone coordinates. From the figure, it emerges that the trajectory of the jammer was correctly identified even if some of the devices were not properly working during the experiment. This demonstrates the robustness of the proposed approach in the presence of malfunctions of some detection units. Additional results on the jammer localization techniques described can be found in [8].
Conclusions
This paper provides a comprehensive account of the activities jointly conducted by the European Commission JRC, the University of Ljubljana and AKOS to characterize and ultimately mitigate the jamming threat. Two unique measurement campaigns have been conducted and several experiments have been conducted to evaluate different detection and localization approaches. The experimental results show that lowpower car jammers can be effectively detected in a road environment using commercial devices such as portable spectrum analysers. Effective and affordable detectors can be obtained using SDR platforms and measurements directly provided by commercial GPS receiver including smartphones. The results obtained are promising and encourage additional work towards the development of effective jammer traps.
References
[1] T. Economist, “GPS jamming: No jamming tomorrow,” Technology Quartely, Mar. 2011.
[2] D. Borio, F. Dovis, H. Kuusniemi, and L. L. Presti, “Impact and detection of GNSS jammers on consumer grade satellite navigation receivers,” Proc. IEEE, vol. 104, pp. 1233–1245, June 2016.
[3] A. G. Dempster and E. Cetin, “Interference localization for satellite navigation systems,” Proc. IEEE, vol. 104, pp. 1318–1326, June 2016.
[4] F. Dimc, D. Borio, C. Gioia, G. Baldini, M. Bazec, and M. Basso, “An experimental evaluation of low-cost GNSS jamming sensors,” NAVIGATION, Journal of the Institute of Navigation, pp. 1–14, Accepted for Publication, Sep. 2016.
[5] D. Borio and C. Gioia, “Real-time jamming detection using the sumof- squares paradigm,” in Proc. of the International Conference on Location and GNSS (ICLGNSS), pp. 1–6, June 2015.
[6] M. Bažec, B. Luin, F. Dimc. “GPS jamming detection with SDR“, Proc. of the 24th International Symposium on Electronics in Transport (ISEP 2016), ITS for efficient energy use, Electrotechnical Association of Slovenia, Ljubljana, Slovenia, Mar., pp.1-4.
[7] J. W. Betz, “Effect of partial-band interference on receiver estimation of C/N0: Theory,” in Proc. of the 2001 National Technical Meeting of The Institute of Navigation, Long Beach, CA, pp. 817–828, Jan. 2001.
[8] D. Borio, C. Gioia, A. Štern, F. Dimc and G. Baldini “Jammer Localization: From Crowdsourcing to Synthetic Detection” Proc. of 29th International Technical Meeting of The Satellite Division of the Institute of Navigation (ION GNSS+ 2016), Portland, Oregon, Sep. pp. 1-10


 (No Ratings Yet)


Leave your response!