| GNSS | |
Solar cycle 24 and SBAS impacts
This paper presents briefly the recent (From Q1 2011 to Q1 2013) evolution of the solar and ionosphere/magnetosphere activities, the data collection network set for Eurocontrol and the CNES Navigation and Time Monitoring Facility, the different observations done on EGNOS and WAAS and some analyses performed to characterize these observations |
 |
|
 |
|
 |
|
 |
|
|
 |
|
The solar activity generates Electromagnetic radiations and Energetic Charged Particles in addition to the Galactic Cosmic Radiation that directly impact the earth magnetosphere and then the ionosphere. There are some regular cyclic activities (a daily one in relation to the sunlight presence, a 27 days one in relation to the Sun rotation, an approximately 11 years one in relation to the Sun Dynamo effect called solar cycle) but there are also solar events such as Sun Flares, Solar Proton Ejections, Coronal Mass Ejection … that create irregularities in particles radiation flow impacting the earth magnetic and ionosphere activities: these impacts are called storms. It has to be known that the delay between the solar event and its impact on earth varies according to its nature:
• The electromagnetic wave impact is quasi immediate.
• The Energetic Particles impact is in a ten minute range.
• A solar wind impact is observable on earth in a 2 or 3 day range delay.
These events have great impact on navigation systems such as sudden changes in the ionosphere delays, increased gradients and/or sudden changes in navigation signal strength often coupled with ionosphere scintillations effect causing navigation signal loss of lock. These impacts observed at the navigation signal reception have then an induced impact in the system applications such as Satellites Based Augmentation Systems (SBAS) in terms of availability and continuity of services. The risk to face a major magnetosphere event was observed to depend on the time in the solar cycle, the higher risk being in the 2 or 3 years after the peak of the solar activity (on figure 1 -0.5 is the solar cycle start, 0 is the solar cycle maximum and 0.5 is the solar cycle end).

Figure 2: We are now approching the peak of solar cycle 24 that is predicted to occur in the Fall 2013 [2].
To take a maximum of benefit of such situation, Eurocontrol has contracted in 2009 a study with Egis Avia leading a consortium composed of CLS, CNES, DSNA/DTI, ENAC, M3Systems aiming at characterising the impact of the solar activity on civil aviations GNSS based applications for different phases of flight during the next period of maximum solar activity and at developing, validating and assessing performance of adequate mitigation actions for the different phases of flight impacted [4]. The first part of this study was a bibliography on past events and the definition of a data collection network to support impact of solar cycle 24 events over the ECAC region (Figure 3).
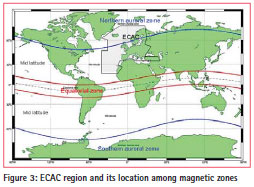
We are now in the second part of the study where the data collection network has been set up and is delivering information enabling to analyse the impact at receiver level and to validate the modelisation done for different ionosphere scenarii to assess the impact at user service levels.
On a second hand CNES has set up in 2010 a facility (NTMF – Navigation and Time Monitoring Facility) aiming at assessing on a regular basis the performances achieved by different navigation systems such as GPS or GLONASS and in the future GALILEO and by the different Satellite Based Augmentation Systems. At the beginning, only EGNOS and its time function, WAAS and GPS performances were assessed but now after a ramp up phase, other SBAS GAGAN and MSAS have been added to the NTMF and GLONASS is expected to be so in the coming months.
These two initiatives enable to observe the recent solar and ionosphere/magnetosphere activities and the impact on SBAS and to perform relevant analyses. Several events were monitored and analysed but this paper focuses on only some of them for which the impact was more or less important (August, September, October 2011, March and July 2012).
Facilities
Eurocontrol Ionosphere Data Collection and Products
The Network
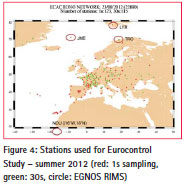
The data collection network (Figure 4) is done by a file transfer protocol from several public networks delivering RINEX observation files sampled at 1 or 30 seconds enabling to have:
• A large scale network based on IGS, EUREF and national networks for large effects
• Some small scale networks in some areas (Toulouse, Madrid. Canary Islands) for more local effects
• Completed when relevant by additional stations from the EDCN [5] and EGNOS networks [6], integration of additional EGNOS stations is foreseen in 2013
In addition to these observations, data from some Ionosphere Scintillation Monitors (ISM) belonging to ESA MONITOR project [7] can be used in the analyses.
Products and External data Data from the different sensors are processed to provide Eurocontrol and partners with
• TEC and TEC gradient maps
• ROTI, STEC, Rate of TEC parameters
• loss of L1 (S1Nb) and L2 (S2Nb) measurements
• S4 and sigmaPhi parameters
Some external and public data are also used:
• Geomagnetic data
• Kp index (Planetary; from 0 to 9)
• ap index (High latitude; from 0 for quiet to over 200 nT for severe extreme storms)
• Dst index (equatorial)
• Solar data
• Sun Spot Number (SSN)
• Radio flux
• Proton flux
• X-ray flux
CNES Navigation and Time Monitoring Facility
CNES NTMF is able to collect different sources of data and to process them in order to evaluate the performances at different levels for different key parameters by comparison. For a particular key parameter, the same method and the same tool is used for each system and the quality of the results is ensured thanks to the possibility to run in parallel two tools developed on the same requirements but by two different teams.
The different performances that are currently monitored in the NTMF are:
• Accuracy, Integrity, Availability, Continuity of each system
• System offset to UTC (EGNOS time only for the moment)
• Interface compliance to standard (MOPS DO229 for SBAS, ICD200 for GPS)
In addition to these parameters that are currently only available on an internal private CNES web site, NTMF is able to deliver on a public FTP server [8] and in the right RINEX format SBAS messages that were broadcasted by EGNOS (Europe), GAGAN (India), MSAS (Japan), WAAS (USA) and even SDCM PRN125 (Russia).
Solar and Ionosphere activities from 2011
Solar Activity
The solar activity can be characterised daily by the daily SSN or the daily F10.7 index. The latter measures the noise level generated by the sun at a wavelength of 10.7 cm at the earth’s orbit at local noon at the Penticton Radio Observatory in Canada. On Figure 5, both indices are plotted over a long period. The recent period is plotted on Figure 6.
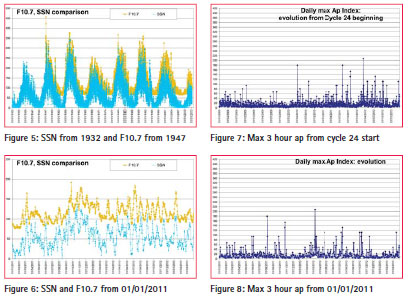
Both SSN and F10.7 indices have variations mainly due to the solar rotation, but the high values are moderate regarding previous cycles and no important spike is highlighted for the moment, events that occurred were not exceptional. Nevertheless we will see later that some impacts on magnetosphere were observed.
Ionosphere/magnetosphere activity
Several indices exist to rank the ionosphere/magnetosphere activity, but for the purpose of this section only the 3-hour ap index, directly related to Kp in order to have a linear scale, is used. Eight values are provided per day. In order to determine the level of activity in the day, we simply look for the maximum over each day (figure 7 and 8).
The table 1 is used to define the status of the ionosphere.
Only one extreme storm has been recorded from the beginning of solar cycle 24, and several were observed in the severe+ category:
• 05/04/2010: ap reached 179 nT (not analysed in this paper)
• 05/08/2011: ap reached 179 nT (partly analysed in this paper)
• 24&25/10/2011: ap reached 154 nT (analysed in this paper)
• 09/03/2012: ap reached 207 nT, the highest magnetic event of cycle 24 until now, just at the limit of the extreme classification (analysed in this paper)
• 15/07/2012: ap reached 132 nT (partly analysed in this paper)
In addition there were several occurrences of other storm categories (table 2).
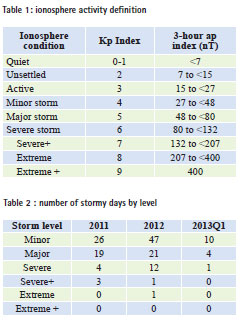
Particular attention has to be paid on the fact that these figures do not represent exactly the number of storm events due to the fact that some storms can occur over two consecutive days.
In order to demonstrate that the impact is not in a simple relation to the intensity of a storm, an event in September 2011 will be also documented.
Observations
A. 05/08/2011 event
Figure 9: The storm began in the evening of the 5th of August and had continued in the morning of the 6th.
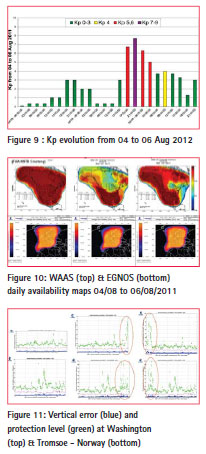
As no important activity occurred on that day, the 4th of August is used as a referenced day for both EGNOS and WAAS. If we have a look at the service availability daily maps, we can observe a reduction for the two systems (figure 10).
At both locations (figure 11), the vertical protection levels were higher when the storm occurred and degradation was really time correlated with the high values of the magnetic index. For WAAS, the protection in the ionosphere domain (GIVE) were set to high values while for EGNOS, some Ionosphere Grid Points in the North of Europe were set to Not monitored, reducing the number of satellites usable for this type of precision approach service. Note that a satellite is usable for the precision approach services when the ionosphere delay affecting its path to the user can be corrected by the ionosphere information sent by an SBAS i.e. there are enough monitored IGP in the surrounding of its ionosphere pierce point (IPP) corresponding to the intersection of the user/satellite path with the ionosphere layer modelled as an ellipsoid with a 350 km constant height above WGS84 [9].
B. 26/09/2011 event
Figure 12: The storm began in the middle of the afternoon of the 26th and had continued until the beginning of the day after. We can observe a more active magnetosphere on the rest of the 27th finishing by a major storm. Over that period, the ap index reached only 92 nT as a maximum
As no important activity occurred on that day, the 25th of September is used as a referenced day for both EGNOS and WAAS.

Figure 13: Degradation in the service availability is observed for both systems but even if the intensity of the event was less important than during the August event, degradation is more important for both systems.
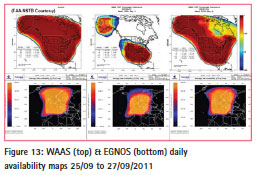
At each location (figure 14), the vertical protection levels were degraded during the storm: either higher (Colorado Spring) than the day before or not computed (Washington, Tromsoe). The impossibility to compute a protection level is due to numerous Ionosphere Grid Points set to Not Monitored in the vicinity of these locations reducing the number of usable satellites under the minimum number (four) required to be able to compute a position solution. We can observe also at Tromsoe an additional degradation in the evening of the 27th of September when a sub storm occurred.
C. 24&25/10/2011 event
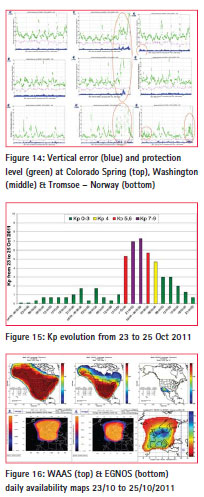
The storm began after 18:00 UTC on the 25th and had continued until 06:00 UTC the day after (figure 15). On the period, the ap index reached 154 nT as maximum.
As no important activity occurred on that day, the 23rd of October is used as a referenced day for both EGNOS and WAAS.
Degradation of service availability is observed for both systems (figure 16). For WAAS the Canada and Alaska were impacted on the 24th while the day after, the degradation is observed on the whole service area. For EGNOS (even if the map for the third day is provided by a different tool due to a regular tool issue), the degradation was also observed but with less impact.
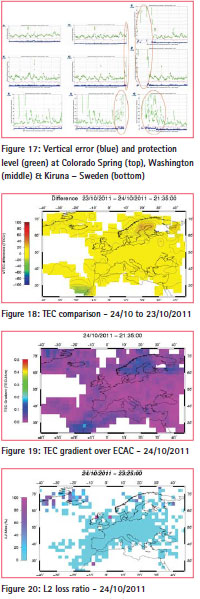
At each location (figure 17), the vertical protection levels were degraded during the storm: either higher than the day before or not computed due to the lack of usable satellites. The periods without position at Kiruna with EGNOS was very short compared to the outage observed at Colorado Springs and Washington (several hours).
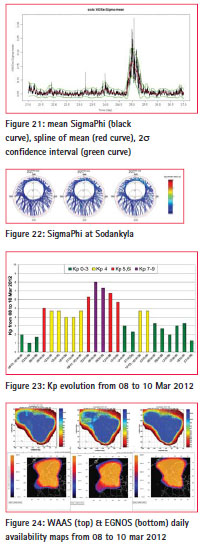
For EGNOS, additional information over ECAC is available (figures 18 to 22). The ionospheric perturbation was visible by a TEC enhancement at the auroral oval on the ECAC region in the evening of October 24, with values up to 40 TECU above the TEC of the day before, near 21h35TU, over Sweden. Large scale smoothed TEC gradients of 0.2 mm/km were observed. The loss of L2 lock when L1 present, increased up to 60% at certain grid points of the auroral oval and was of a quasi 20% ratio over Iceland and Greenland (figure 20).
The mean variation of SigmaPhi measured at Sodankyla (Finland) and plotted from the 21st of Otober to the 27th pointed out a clear enhancement in the evening of the 24th and beginning of 25th.
The polar plots of SigmaPhi parameter from the 23rd to the 25th show that satellites that were in the North but also in some others directions were affected (clear blue)
D. 09/03/2012 event
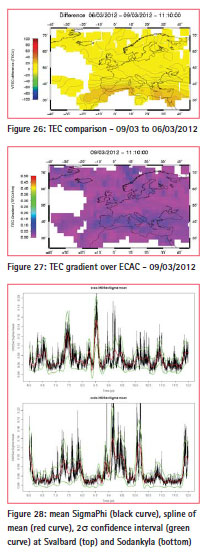
Figure 23: The storm began in the morning of the 8th and achieved its maximum one day later and finished in the evening of the same day. On this period, the ap index reached 207 nT as maximum.
The 10th of March is used as reference day.
Degradation of service availability is observed for both systems (figure 24), mainly on the 9th (Alaska and West Canada for WAAS, Iceland and North of Scandinavia for EGNOS). Nevertheless, the impact is less important than for Aug, Sep or Oct 2011 event. It has to be noted that both systems were upgraded between last quarter of 2011 and March event to improve their reliability during ionosphere events ([10], [11]).
No local degradation has been observed at US locations used in the NTMF to monitor WAAS performances. At Tromsoe, degradation is observed late in the evening of the 8th and in the morning of the 9th due to some high GIVE or not monitored IGP (figure 25). The main characteristics of the event on March 9th are a TEC enhancement in Southern Europe, with values 30 TECU above the TEC at the same hour on March 6th, the last quiet day before. The large scale gradients were up to 0.1 mm/km at different places, half of what was observed for the October event (figure 26 and 27).
Over the period between the 6th and the 12th of March, especially the 7th, 9th and 10th March, the SigmaPhi is well correlated to the ap index for the Sodankyla station. But, for the Svalbard station which is much higher in latitude this is not the case because the most intense perturbation of SigmaPhi occurred during the 8th of March (figure 28).

E. 15/07/2012 event
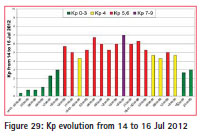
Figure 29: The storm began on the 14th evening, achieved its maximum 24 hours later and has continued until the 16th in the afternoon. The activity was calm on the 13th; this day is chosen as reference day.
No real degradation was observed for WAAS (figure 30). EGNOS was slightly impacted on the 14th at its northern edge and a little bit more on the 15th (towards Iceland area).
Figure 31: Some degradation is observed at Tromsoe on the 15th during the night and in the afternoon. Duration of the degradation is not so important than the one for previous event.
F. Qualitative synthesis and discussion
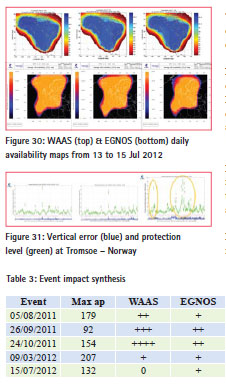
A qualitative assessment of the impact of each event has been established in regards to the importance of the degradations observed in the availability maps (table 3).
The use of ap (or Kp) index is suitable for detecting ionosphere/magnetosphere events. A clear relation can be highlighted between the loss of dual frequency data in L2 codeless technique and this index [4], but it is not possible based on the analyses presented here to forecast the importance of the outage caused by the detected event. Indeed, no relation can be put in evidence between the impact importance and intensity (max ap) of the illustrated events.
The effects of 2012 events are less important than those of 2011. It is not sure that this can merely be explained by the modifications brought to both system releases ([10] & [11]). Some other factors are likely to play a role such as the gradient of activity, solar events type and energetic particle flux arriving on Earth, as well as the GPS constellation situation over the stations network. Part of these factors and observed parameters will be taken into account to define scenarios for modelling the impact at service level [12].
Conclusions
This paper shows that the solar activity is lower than previous cycles (as it has been forecasted for more than a couple of years now). Nevertheless, the ionosphere and magnetosphere activities are onset and storms occur. Even if no extreme+ event was detected from the beginning of the current solar cycle, some severe storms and an extreme one occurred. Their impact on WAAS and EGNOS was observed but it has to be noted that the importance of the observed impact is not in a mere direct relation to the intensity of the storm.
As current and future work in the scope of the study performed for Eurocontrol, it is expected to have a better modeling of this impact on the civil aviations GNSS based applications, including SBAS thanks to the observations performed with the Eurocontrol Ionosphere Data Collection network.
Acknowledgment
Part of the activities developed to achieve some results presented in this paper, were created by EUROCONTROL for the SESAR Joint Undertaking within the frame of the SESAR Programme cofinanced by the EU and EUROCONTROL. The opinions expressed herein reflect the authors view only. The SESAR Joint Undertaking is not liable for the use of any of the information included herein. The analyses cover only the first quarter of 2013 as this work was presented at ENCGNSS 2013 (23-25 April, Vienna, Austria).
References
[1] N. Suard and al, Assessment of an Ionosphere Storm Occurrence Risk, Proceedings of the European Navigation Conference 2011, London
[2] NASA Solar Cycle prediction team, http://solarscience.msfc.nasa.gov/ predict.shtml, updated 01/04/2013
[3] SIDC-team, World Data Centre for the Sunspot Index, http:// www.sidc.be/sunspot-data/
[4] F. Carvalho and al, GEOPOS workshop on ionosphere, Oct 2012, Paris
[5] EGNOS Data Collection Network by Eurocontrol, http://edcn2.pildo.com/home/
[6] EDAS (EGNOS Data Access Service), http://www.gsa.europa.eu/egnos/edas
[7] Y. Béniguel and al, Ionospheric Effects on GNSS Performance, NAVITEC 2012, December 2012. ESTEC, Noordwijk, ESA MONITOR project, http://monitor.estec.esa.int/Monitor/
[8] ftp://serenad-public.cnes.fr/ SERENAD0/FROM_NTMF/MSG/
[9] User Guide for EGNOS application developers, Ed 2, 15/12/2011
[10] Iono Robustness” Upgrade to Increase WAAS Reliability, http:// www.faa.gov/waas/news/
[11] http://www.essp-sas.eu/downloads/ hfeyhu/service_notice_3_v01_01_ egnos_upgrades_in_q1_2012.pdf [12] E. Robert, Eurocontrol Space Weather Activities, Space Weather Workshop, Boulder, CO – April 2012


 (6 votes, average: 4.00 out of 5)


Leave your response!