| GNSS | |
Road design parameter analysis based on the GNSS data
The purpose of current article is to demonstrate the use of such application in analyzing the parameters of road design |
 |
|
 |
|
Recently, most of the smart phones come with GNSS device. Owing to this, many GNSS based applications are being developed. Some of the applications, in spite of being free of cost, have full of features. The purpose of current article is to demonstrate the use of such application in analyzing the parameters of road design. For this purpose, an analysis was done to find a relationship between speed and the two other parameters, tortuosity and absolute elevation difference. Basically, speed is dependant on the road condition, the horizontal curvature, vertical curvature and the driver’s attitude and skill. In the present study only horizontal and vertical curvature were considered. Tortuosity is a measure of curves and bends in horizontal plane while vertical curvature can be represented by the sum of absolute difference in elevation. For a given section of a road, tortuosity is defined as the ratio of actual length to the straight line length between the end points of the section. In the present study, a road from capital city Kathmandu to one major city in plane area of Nepal was traversed by privately owned passenger micro bus. Samsung J7 Prime was used as Android device to record GNSS data using OSMTracker app. The data recorded by the application was analyzed using QGIS (for GIS) and R (for statistics).
Inroduction
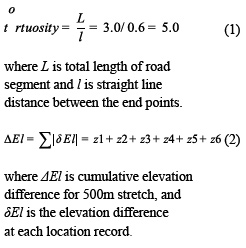
Current research attempts to find a statistical correlation between the speed of vehicles and the horizontal and vertical curvatures of road segments. It is possible to use the geometrical design document to find the curvatures, however, in the present study, two parameters were developed to represent horizontal and vertical curvatures respectively so that these parameters can be calculated by the location information. The two parameters introduced in the study are:
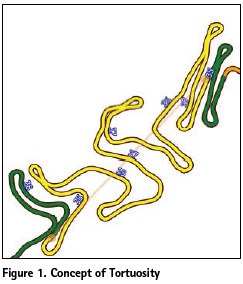
1 Bhaduri (1992) had introduced the concept of tortuosity. Tortuosity (of a section of road) is defined as the ratio of length of the road section to the straight distance between the starting point and the end point. Figure 1 illustrates the concept of tortuosity.
2 Sum of absolute elevation difference (Referred to as cumulative elevation difference): This parameter is illustrated in Figure 2.
Above two parameters can be expressed as following two equations.
Research methodology
Current research has following components:
1 Recording the location of vehicle
2 Dividing into equal segments using QGIS and python code
3 Multivariate statistical analysis of the three parameters: a) speed, b) tortuosity and c) cummulative elevation difference
Description of tracked road
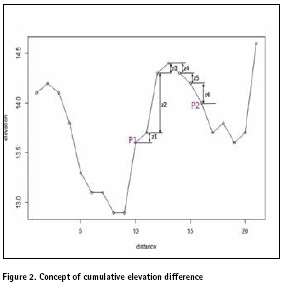
Nepal is about 900km long in the east-west direction while the width in north-south direction varies from about 100km to 200km. More than 70% of the area of Nepal lies in the mountainous terrain. Northern part of the country is mountainous and the southern part connected to Indian boarder is flat terrain. In the present analysis, location tracking was done from capital city Kathmandu to Biratnagar in the southern Terai planes of Nepal. Based on the terrain, the track can be divided into two parts: 1) Kathmandu to Bardibas (about 200km in mountainous terrain, includes about 160km of BP highway ), 2) Bardibas to Biratnagar (about 200km in plane terrain, includes 170km of East-west highway and 30km of urban road from Inaruwa to Biratnagar). Figure 3 and Figure 4 shows the two portions of the whole track.
Both the portions of Road were in good condition. However, the first section, for major part, is 1.5 lane narrow road while the second section is wide 2 lane road. Final 30km of the road passes through As the number of traffic is low in the first section, the width of road is considered to have no effect on the speed of the vehicle.
Location tracking
Location was tracked using android device with following specification.
Model: Samsung J7 Prime, OS : Android 7.0
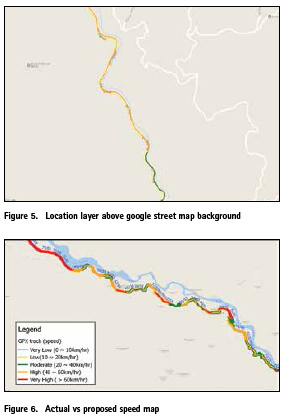
There are large number of android apps available for navigation and most of them are freely available. For the present analysis, an offline, open source app called ‘OSMTracker’ (See: https:// wiki.openstreetmap.org/wiki/OSMTracker_(Android)) was used. Its interface is simple. A single button click starts the app and as soon as location fix is available, it starts logging until stopped by using menu. On the way, during location tracking, it is possible to log points of interest which can include textual description, photograph, audio, etc. Figure 5 shows a portion of road with google street background. It shows that the location tracked by the device is fairly accurate.
Segmentation of the track
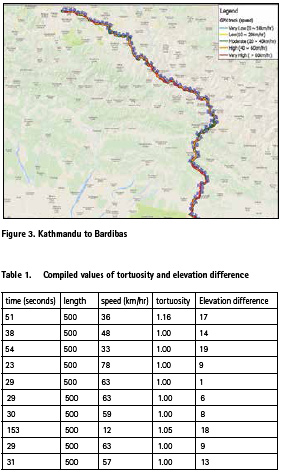
Whole tracked road was divided into 500m segments. QGIS was used for GIS based analysis. A python code was developed which can do the followings in a single run:
▪ Divide the track into equal segments (length of segment can be provided as variable)
▪ Calculate speed, tortuosity and cumulative elevation difference as shown in Table 1
▪ Calculate fitted (proposed) speed which is obtained after multivariate analysis
Calculation of correlation
Relation between speed of the vehicle was calculate using R programming language. ‘rstats’ package of R provides many statistical tools for data analysis. In the present analysis, simple function for fitting of linear models was used. Following function gives the coefficients of linear function of fit.
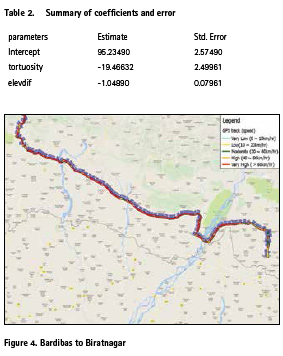
Summary of the analysis result is shown in table 2.
Actual vs proposed speed can be shown in map (Figure 6).

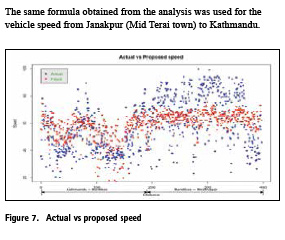
Figure 7 shows the actual versus fitted values of speed.
It is evident from the graph that the proposed speed is generally lower than the actual after entering the flat terrain at Bardibas, excluding the final portion which passes through narrow and busy road from Inaruwa to Biratnagar and the urban road in Biratnagar itself.
The same formula obtained from the analysis was used for the vehicle speed from Janakpur (Mid Terai town) to Kathmandu.
The road passes through a) Janakpur to Bardibas 32 km (in flat terrain), b) Bardibas to Kathmandu (mountainous terrain).
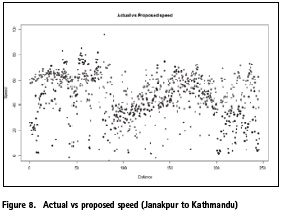
The graph (Figure 8 Actual vs proposed speed (Janakpur to Kathmandu) clearly shows the correlation between the speed difference (actual vs proposed) and the real condtion as follows:
1 First few kilometers of road lies in the urban area of Janakpur, therefore the actual speed is much lower than proposed speed.
2 For the last 50 kilometers of the road there was heavy traffic jam due to maintenance work. As such, the actual speed is quite low.
Conclusions and discussion
Among the many parameters affecting the vehicle speed, effect of tortuosity and absolute elevation difference was analyzed. Current analysis shows the capability of GNSS based location tracking in the analysis of road parameters. Further analysis is needed to find the proper value of the coefficients for different types of road. The obtained coefficients can be used to study the conditions of road. Low speed compared to the proposed speed (computed using the parameters and coefficients) suggests either road pavement condition is bad or there is traffic jam. Similarly, higher actual speed may reflect the driver’s reckless driving.
Acknowledgments
Maps used in the figures are generated with ‘Google Maps’ background in QGIS using Open Layers plugin. Use of Google maps is duely acknowledged.
References
Bhaduri, Shukla. 1992. “Transport and Regional Development: A Case Study of Road Transport of West Bengal.” Concept Publishing Company, 146–47.


 (No Ratings Yet)


Leave your response!