| Surveying | |
Real time monitoring of Dalian Beida Bridge
|
Wang Jun, Yi Xiaodong, Wei Erhu
|
||||||||||||||||||||||||||||||
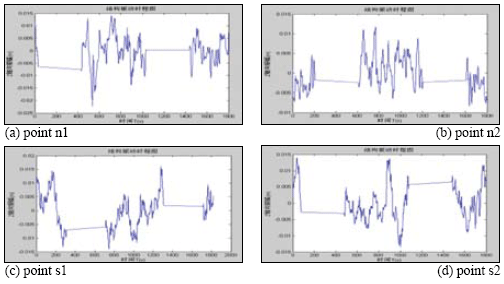
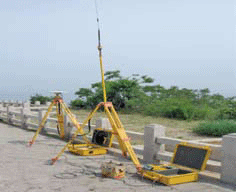
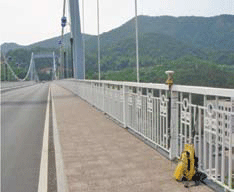
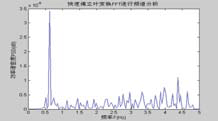
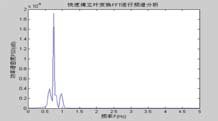
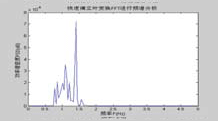
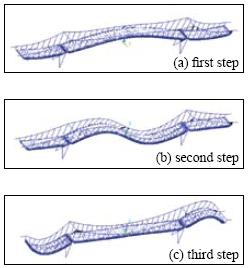
Testing point spectral analysis based on FFTBridge vibration frequency resolving in the condition of motivation contextBased on the motivation context, bridge vibration signal is not all the pure sine form[5]. According to the Fourier analysis, vibrating signal could be decomposed into many harmonic components. Fig 4 Time series of 4 testing points during same time-interval Fig 3 GPS device using in testing form[5]. According to the Fourier analysis, vibrating signal could be decomposed into many harmonic components. Actually, based on the time series, the (a) first step (b) second step (c) third step Fig.5 Power spectral density of bridge bridge vibrates frequency of fs in various steps harmonics could be decides by spectral analysis which are supported by measured waveform or the data come Tab.1 Comparison of vibration frequencies between GPS solution and other methods Fig 6 bridge various vibration types using finite element method from discrete processing. Formula (5) is the discrete form of Fourier transform. In Eq (5) Where cross direction express the frequency (Hz) vertical direction express the PSD (dB). Validity checking of GPS dynamic surveying techniqueDeterministic model method based on finite element Because the testing bridge has complete structural design material, in order to understand the feasibility of using the GPS dynamic surveying technique to get the bridge multistage vibration frequency. A deterministic model has been established to resolve the bridge vibration frequency caused by load with the finite element method. The software of finite element computation is Ansys. Accelerometer measurement methodIn the same point and same time, Accelerometer with the type of 891, which was produced by State Bureau of Seismology Engineering mechanics Research institute, had been set to obtain bridge vibration frequency, and the data processing software adopted Donghua data collection and processing system. It is shown from table 1 that the vibration mode deviation of bridge first three steps in same place is very small when comparing between the GPS surveying result and the accelerometer measurement as well as the result of using the Ansys finite element resolving. Every step data matchs well among them except the second step frequency value acquired by accelerometer is bigger. It is also known from the bridge testing that the accelerometer has been used in structure vibration test for its advantage of light weight, small volume and no affecting to testing system, but this method could make bigger measuring error than other’s and the deformation result is not direct-viewing too, when the structure oscillation is slow, it could not measure the structure of whole vibration amplitude. ConclusionThe vibration mode measured by GPS sensor receiver and accelerometer coincide with the result of using the finite element method, it indicates that the overall rigidity of the testing bridge structure conforms to the actual requirement From the view of testing analysis flow, the GPS-RTK method has the characteristic of simple operation, nimble and convenient; with the GPS receiver, it is easy to monitor the bridge of three dimensional dynamic deformation in real-time as well as first step bridge vibration mode frequency or higher step one which can provide the datum data directly for the bridge use, maintenance and condition evaluation. Reference:[1] J.J.Guo, L.J.Dai, Y.C.Lu, Study of the Humen bridge GPS(RTK) realtime displacement monitors Bulletin of Surveying and Mapping, 2000.12:4-5. |
||||||||||||||||||||||||||||||
|
||||||||||||||||||||||||||||||
|
Pages: 1 2





 (No Ratings Yet)


