| Mapping | |
Mapping physical development changes using Geospatial techniques
The aim of this research is to produce a new and updated map Lagos Island Local Government Area, Nigeria and document changes that have occurred over time |
|
Abstract
The scope of the research work comprised the planning and preliminary data requirement analyses, acquisition of preliminary data such as base map, data processing and database creation process, GIS implementation using linear referencing, map creation and analyses of data as well as the presentation of results. The aim of this research is to produce a new and updated map of the study area and document changes that have occurred over time. The objectives therefore includes; obtaining an older map of Lagos Island and update its features, obtaining the GPS coordinates within the study area for geo-referencing, analyzing the land use patterns for the study area, producing a new map in a Geospatial Information System Environment and analyzing the social-economic activities within the study area. The study area of this research is Lagos Island Local Government Area, in Lagos State, Nigeria. It is located in the South-western part of Lagos. The Study area is Located to the extreme south of Lagos, within the latitude 6°22′- 6°25′N and Longitude 3°25′E around Atlas Cove Depot and Jetty. Methodologically, this study employed field studies where equipments such as Garmin GPS MAP 62 (Series), Data storage, manipulation and retrieval hardwares were deployed. GIS operations were carried out using softwares such ArcGIS 10.8, AutoCAD 2007 for drafting, GoogleEarth-4.2 pro Application, Microsoft Excel 2007 for the storage of easting and northing (x, y) values, for all segment points and points of interest in the study area ArcGIS 10.8 software was used for Dynamic segmentation process and GIS analysis involving spatial analysis and search while Microsoft Word 2007 was used for documentation. The result showed new spatial features such as reclaimed wet lands, new roads, buildings and social amenities located in the updated map. Finally the study by demonstrating the capacity of the use GIS and remote sensing techniques for updating of maps.
Introduction
Maps have being used for centuries to represent the environment, and shows locations, distances, directions as well as size of an area or region. Maps also display geographic relationships, differences, clusters and patterns. It can further be explore for other purposes such as navigation, exploration, and illustration. More so, for identification of infrastructural positions and their availabilities, even for communication of activities such as resource, disaster [6].
Mapping has been an integral part of census taking for a long time. Very few enumerations during the last several census rounds were executed without the help of detailed maps. In general terms, digital mapping serves several purposes in policy decisions as well as implementation. Cartography has been affected by the information revolution somewhat later than other fields. Early computers were good at storing numbers and text [12]. Maps, in contrast, are complex, and digital mapping requires large data storage capacity and fast computing resources. Furthermore, mapping is fundamentally a graphical application, and early computers had limited graphical output capabilities [13]. The earliest mapping applications implemented on computers in the 1960s did not therefore find wide application beyond a few government and academic projects. It took until the 1980s for commercial geographic information systems to reach a level of capability of getting it right. GIS facility now plays a key role in helping to make map making easier in computerised environment. It is an application designed for geodata base data collection, manipulation and graphical expression [8, 16].
2. GIS applications
Digital mapping and spatial analyses have been developed simultaneously in several related fields. The present status would not have been achieved without close interaction between various fields such as utility networks, cadastral mapping, topographic mapping, thematic cartography, surveying and photogrammetry, remote sensing, image processing, computer science, rural and urban planning, earth science and geography. The GIS technology is rapidly becoming a standard tool for management of natural resources. The effective use of large spatial data volumes is dependent upon the existence of an efficient geographic handling and processing system to transform this data into usable information.
The GIS technology is used to assist decision-makers by indicating various alternatives in development and conservation planning and by modelling the potential outcomes of a series of scenarios. It should be noted that any task begins and ends with the real world. Data collected are about the real world. Of necessity, the product is an abstraction; it is not possible (and not desired) to handle every detail. After the analyses of data, information is compiled for decisionmakers. Based on this information complied, actions area taken and plans implemented in the real world. This is what the GIS technology has helped in doing and more fields are beginning to see the necessity of the Geographic Information System (GIS) [12].
2.1. Major areas of application of GIS
Some of the major areas of the application of GIS are briefly described below.
1. Street Network Based Application – It is an addressed matched application, vehicle routing and scheduling location and site selection and disaster planning.
2. Different streams of planning – Such as urban planning, housing, transportation planning architectural conservation, urban design, and landscape.
3. Natural Resource Based Application – Management and environmental impact analysis of wild and scenic recreational resources, flood plain, wetlands, aquifers, forests, and wildlife.
4. View Shed Analysis – Hazardous or toxic factories siting and ground water modelling. Wild life habitat study and migration route planning.
5. Land Parcel Based – Zoning, subdivision plans review, land acquisition, environment impact analysis, boundary justification, nature quality management and maintenance etc.
6. Facilities Management – GIS can help in the location of underground pipes and cables for maintenance, planning, tracking, energy use.
2.2. Scope of the study
The scope of the research work is as follows;
1. Planning and preliminary data requirements analyses.
2. Acquisition of preliminary data, like Base Map.
3. Data processing and database creation process.
4. GIS implementation using linear referencing.
5. Map creation and Analyses of data.
6. Analyses and Presentation of results.
2.3. Aim and objectives
The aim of this research is to produce a new and updated map of the study area and document changes that have occurred over time.
The objectives of the project are as follows:
1. To obtain an older map of Lagos Island and update its features.
2. Obtain the GPS coordinates within the study area for geo-referencing.
3. To Analyse the land use patterns for the study area.
4. To produce a new map in a Geospatial Information System Environment.
5. To analyze the social-economic activities within the study area.
2.4. The study area
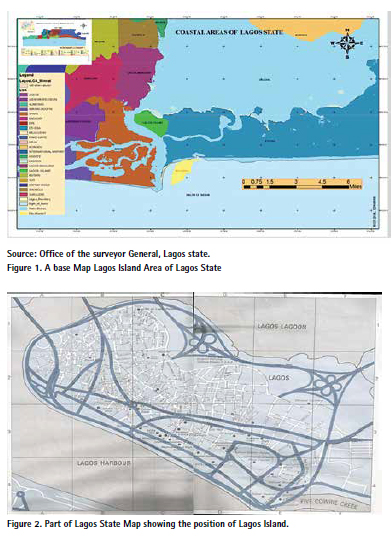
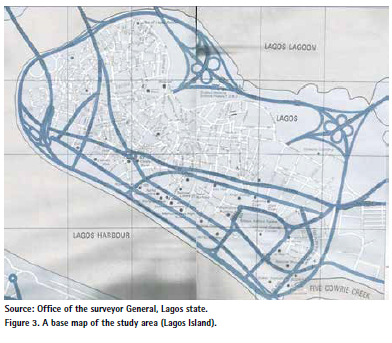
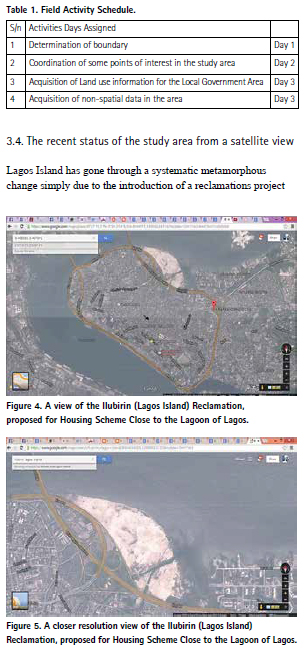
The study area of this research is Lagos Island Local Government Area, in Lagos State, Nigeria. It is located in the Southwestern part of Lagos. The Study area is Located to the extreme south of Lagos, within the latitude 6°22′- 6°25′N and Longitude 3°25′E around Atlas Cove Depot and Jetty. Atlas Cove is located at the entrance of the Lagos Harbour (Commodore Channel) – the only main entrance of the Lagos Lagoon and Badagry Creek complex to the Atlantic Ocean and directly opposite the East Mole, Some 2.5km south of the Apapa port complex and about 1.75km north of the Lighthouse Beach (takwa Bay Beach). Administratively, It shares its northern boundary with Lagos Mainland LGA and the Lagos lagoon, to the east it is bounded by Eti – Osa L.G.A. and to the west by Apapa L.G.A. It covers an area of 4.993 Sq. Kilometres (figure 1). The area is low lying with an elevation of about 0.5-3m above sea level [3].
Lagos Island is connected to the mainland by three large bridges which cross Lagos Lagoon to the district of Ebute Metta. It is also linked to the neighbouring island of Ikoyi and to Victoria Island. The Lagos harbour district of Apapa faces the western side of the island. Forming the main commercial district of Lagos, Lagos Island plays host to the main government buildings, shops and offices. The Catholic and Anglican Cathedrals as well as the Central Mosque are located here.
The study area falls within the hot humid equatorial climate that is generally experienced in the Lagos area with generally high temperature, humidity and rainfall. The mean annual temperature for the area is about 27.5°C. The mean monthly minimum temperature is about 24°C and the mean monthly maximum temperature is about 29.5°C. Lagos area receives an annual rainfall of about 1,524mm to 2,032mm with an annual mean of 1,800mm. The number of rainy days is about 121 days. Although rainfall occurs all year round, it is not uniformly temporally distributed.
2.5. Significance of the research
This research is designed to equip scholars with the nitigrities of map making and interpretation as well as analysis of the spatial features of the map [4]. The data gathering of of spatial and non-spatial data features within the study area such as roads, rivers, railways, buildings etc, for effective interpretation of the map is a vital part of the whole exercise [15]. It will also help the student to be more familiar with the GIS environment, with basic training on the easy logic to query and analyses features on a map. On the overall view, this research is significant in order to aid the student in the following areas: 1)
1. To enhance the student ability in map production.
2. To aid the student knowledge on the use of geospatial software.
3. To help the student analyse and interpret the features on the map.
2.6. Map update in the GIS enviroment
Digital map data are necessary for the achievement of producing a recent map in a ArcGis environment. One must have a prior knowledge about the area of concentration on available as a base map. (figure 1) We will use the term layers from this point on, since this is the recognized term used in ArcGIS. Layers represent, in a special digital storage format, features on, above, or below the surface of the earth. Depending on the type of features they represent, and the purpose to which the data will be applied, layers can be either a Vector data, which represent features as discrete points, lines, and polygons or a Raster data, which represent the landscape as a rectangular matrix of square cells. Hence, spatial data are often referred to as layers or coverage.
3. Materials and methods
This aspect centres on the steps involved in carrying out the project. It gives in details the breakdown of the tasks carried out to achieve the aim of the project [2, 11]. The description is as follows.
3.1. Project planning (reconnaisance)
Reconnaissance is the preparatory stage for project execution. It involves the overall assembling, examination, and collection or over viewing of project site or the study area and logistics for successful execution, that is, a successful project depends on a good reconnaissance or preliminary investigation and planning exercise. Its value prior to the real survey work cannot be under estimated and it enables one to obtain the picture of the whole area in his mind to work economically in terms of time, labour, energy and funding [17].
For the purpose of the work, a precise reconnaissance was carried out on the study area in to have a grounded knowledge of the area in question.
The reconnaissance was carried out in two forms and they are as follows;
1. Planning
2. Field Reconnaissance.
3.1.1. Planning
The planning involved the collection of information about the study area, the necessary materials and equipments needed to carry out the project. It centred on the assembling of existing data, determining how to get to the study area as well as the needs analyses of the project. A careful understanding of the needs and the data to be obtained from the study area was well analysed.
3.1.2. Field reconnaissance
Field reconnaissance involves the actual visitation to the study area with the aim of determining the typical areas of interest and the existing features present in the study area. This visitation also help in knowing the best times to carry out the observations or data acquisition in order to obtain the best results at minimal cost. A preliminary detailed field study was carried out before the actual data acquisition process.
In essence, it requires a rigorous and strategic plan to be able to cover the numerous streets in few days to collect different sets of data, even with little available time. The team had to employ careful and intelligent strategy to achieve tangible result [1, 16].

(i) Systems Selection
This comprises of both the equipment and software used in the project execution. It includes the hardware and software used for data acquisition, management and information presentations.
(ii) Equipment
The equipments are as follows.
1. Garmin GPS MAP 62 (Series).
2. Data storage, manipulation and retrieval hardware: A host laptop computer with configuration Core 2 Duo, 250 Giga byte hard disk (memory space), 4GB of RAM.
(iii) Software
The software performs the GIS operations. The project was carried using the following software:
1. Window 7 was used Operating system was used for this project.
2. AutoCAD 2007 for drafting.
3. GoogleEarth-4.2 pro Application.
4. Microsoft Excel 2007 for the storage of easting and northing (x, y) values, for all segment points and points of interest in the study area.
5. ArcGIS 10.1 software was used for Dynamic segmentation process and GIS analysis involving spatial analysis and search.
6. Microsoft Word 2007 fordocumentation.
3.2. Preliminary data acquisition and operations
In the cause of the data acquisition process, we considered the requirements of the project in terms of its scope, objectives and of course the aim. Hence, after the planning stage, we resolved that the following preliminary data would be acquired.
1. A base map of the study area, showing the roads in the study area.
2. Coordinates of some points of interest for georeferencing of the base map.
These set of data were obtained and used to reproduce the map of the study area. This was of great importance as it prepared us for the actual fieldwork [14].
The map which served as a guide during the actual field operations was very handy and useful for easy navigation on the best positions for the data acquisition process for the roads covered in Lagos Island Local Government Area.
3.3. Field operations
This aspect of the research is centred on the activities carried out on the field or study area. The fieldwork was in stages and at different days of the week. Roads to be covered were grouped and a particular day was attached. The description of fieldwork is as detailed in table1.
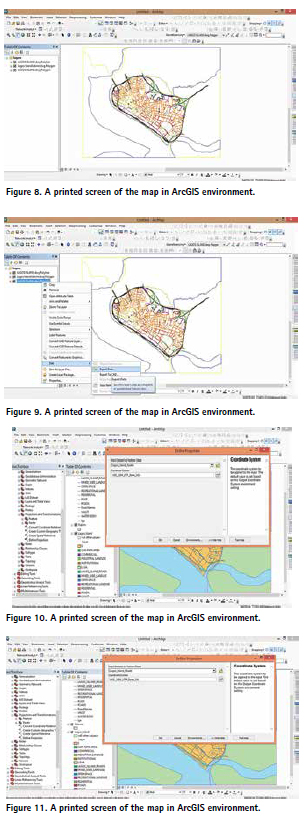
3.4. The recent status of the study area from a satellite view
Lagos Island has gone through a systematic metamorphous change simply due to the introduction of a reclamations project just at the outer North-western part of the island. The new land project was completed around 2012, owned by the Lagos State
Government to introduce new type of development which is necessary for the demand for development, as a strategy to overcome the scare availability of empty vast land to suit recent building designs for both housing and commercial activities.
Figure 4 and figure 5 are the images of the new land name Ilubirin Housing Project.
4. Results
Below are the steps taken when carrying out the updated map of Lagos Island LGA Points of interest like Schools, Police stations, Churches, Mosques and other land use points were picked using the handheld GPS.
Steps taking:
1. Import the Base Map into AutoCAD Platform knowing the coordinate of major spots of on the map.
2. Geo-reference the points to related to the proper locations of the base to the earth surface.
3. Create layer for different properties that will be vectorized upon the base map.
4. Import the image of the new area Ilubrin (aerial view) and repeat step 1, 2, 3.
5. Vectorise the area with new layer- it suggested to name the layer (Ilubirin, as done in this exercise).
6. We imported all the vectors to ArcGIS environment.
7. Convert all Layers imported to Shape files (.shp) referencing it to the WGS 1984. Zone 31NDatum.
8. The shapefile (polygons, Polylines and Points) are modified with colour interpretation.
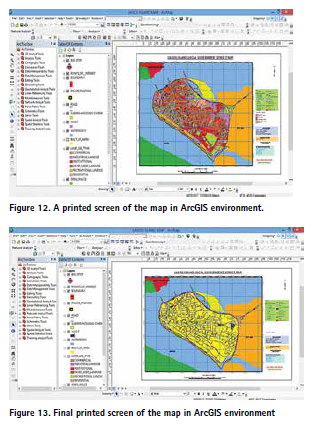
9. The last modification was done with layout view. This is where symbolic description, Title, Legends, Calibrations and North Symbol are inserted to produce a final map.
5. Conclusion
Lagos Island Local Government Area can be described as a placed with a mixture of land use. It is referred to this because it comprises of commercial, institutional residential land uses [5]. This makes it a typical place for study, as the routes in the area are well affected by the various activities there in [6, 10]. The area is known for its robust commercial activities, by the present of huge market system, banking activities, and government institutional offices which give it an attraction to millions of inhabitants daily to transact business. The advantage contributes thus as a factor to increasing population and development projects for housing and business [7, 9].
Furthermore, Lagos Island contains a central business district. This district is characterized by high-rise buildings. Other important activities and historical monuments in Lagos island are the locations of many of the city’s largest wholesale marketplaces (such as the popular Idumota and Balogun markets), the National Museum of Nigeria, the Central Mosque, the Glover Memorial Hall, Christ’s Church Cathedral (CMS) and the Oba Palace. Though formerly in a derelict condition, Lagos Island’s Tinubu Square is a site of historical importance; it was here that the Amalgamation Ceremony that unified the North and South protectorate to form Nigeria took place in 1914.
One of the predominant problems facing Lagos metropolis is that of promoting development, which adversely leads to attraction of more populace, a causative to traffic congestion. This arises from the fact that Lagos metropolitan lands are becoming increasingly scarce resources. The point is that metropolitan Lagos requires land for numerous activities. On the other hand, land is a finite resource, while the demand for land increases, thereby posing challenges. It should be noted that human needs must be satisfied on the fixed land and development must be located on the limited land. Activities have to compete for the use of best sites for their location; hence the principle of optimality has to be adhered to at the expense of the specified space standards and permissible development in that location. Aluko, Ola (2011).
References
[1] Adams, T. M., N. A. Koncz, et al., 2001. Guidelines for the implementation of multimodal transportation location referencing systems. Washington, DC, National Academy Press.
[2] Amiegbebor, D. 2007. Road Transport Network Analysis in Port Harcourt Metropolis, Journal of Research in National Development 51: 42-50.
[3] Aminigbo, L. M. O et al (2021), Analyses of land use change in Etiosa L.G.A of Lagos State Nigeria from 2004 to 2010. American Journal of Environmental Sciences and Engineering, USA.
[4] Binns, Sir Bernard O. (1953). Cadastral surveys and records of rights in land. Rome: FOA Land Tenure Study.
[5] Briggs, D. W. and B. V. Chatfield 1987. “Integrated Highway Information Systems,” NCHRP.
[6] Burroughs, P. A. (1986). Principles of Geographical Information Systems. Principles and Applications. London: Longman.
[7] Dale, P. F. and John D. McLaughlin (1989). Land Information Management. New York: Oxford University Press.
[8] Dueker, K. J. 1987. Geographic Information Systems and Computer-Aided Mapping, “Journal of the American Planning Association”. ESRI, 1993. User’s Guide of Dynamic Segmentation, Redland, CA.
[9] ESRI White Paper (2001). Organizational Structure for Local Government GIS. A survey: http:// www.esri.com. [10] Fletcher, D. 1987. Modeling GIS Transportation Networks, “URISA Proceedings”, Vol. II, pp. 84-92.
[11] Goodchild, M. F., 2000. GIS and Transportation: Status and Challenges. GeoInformatica, 42, pp. 127-139.
[12] Huang, B., 2003. An object model with parametric polymorphism for dynamic segmentation. International Journal of Geographical Information Science, 174, pp. 343-360.
[13] Kansky, K. 1963. Structure of Transportation Network: Relationships between Network Geometry and Regional Characteristics, Research Paper 84. Chicago: University of Chicago. 155.
[14] Li, X. and H. Lin, 2006. A Trajectory-Oriented, Carriageway Based Road Networ k Data Model, Part 2: Methodology GeospatiaI Information Science, 92, pp. 112-117.
[15] Malaikrisanachalee, S. and T. M. Adams, 2005. Lane-basedNetwork for Transportation Network Flow Analysis and Inventory Management. Transportation Research Board, 1935, pp. 101-110.
[16] Miller, H. J.; Shaw, S. L. 2001. Geographic Information Systems for Transportation: Principles and Applications. New York: Oxford University Press. 470 p.
[17] Obafemi A. A. et al. 2011. Road Network Assessment in Trans- Amadi, Port Harcourt in Nige ria Using GIS, International Journal for Traffic and Transport Engineering, 2011, 14: 257–264.
The paper originally published in American Journal of Environmental Science and Engineering. Volume 5, Issue 4, December 2021, pp. 113-123. doi: 10.11648/j.ajese.20210504.15 is republished with the authors’ consent.
Copyright © 2021 Authors retain the copyright of this article.This article is an open access article distributed under the Creative Commons Attribution License (http://creativecommons. org/licenses/by/4.0/) which permits unrestricted use, distribution, and reproduction in any medium, provided the original work is properly cited.


 (No Ratings Yet)


Leave your response!