| GNSS | |
Geo-spatial techniques: An Instrument for regional planning
The present paper focuses on the geo-spatial approaches used to determine the changes occurring on the land surface using GIS tools and techniques, followed by a case study to demonstrate its usage in regional planning |
 |
|
Remote Sensing Systems optimizes the usage of advanced camera sensor technology for capturing satellite imageries of objects present on the earth, by means of transmitting signals and spectral radiance captured through a different wavelength region from a distance. Rationally, the remote sensing system has three main indelible constituents: electromagnetic radiation, remote sensors and platforms that capture remotely sensed images (commonly known as satellite images). Wherein, Geographic Information Systems allows performing spatial analysis on the data procured through remote systems. In depth understanding of the above systems is a precondition for data capturing and data analysis. By and large, the strong analytical capabilities of the software are well recognized by planners, decision making authorities, and policy makers.
Sivakumar (2010) highlighted the significant advances of sensor technology have allowed the subdivision of spectral ranges of electromagnetic radiation into several bands for constructing multispectral images. The spectral bands information present in a particular scene of an area is used appropriately to undertake spatial analysis on satellite imagery for constructing the composite image by combining all the bands of particular scene. Each gray scale single band image is theoretically known as the pan-chromatic image, but a combination of three or more bands generates color composite images known as multispectral images.
Exceptional progress was made towards improving the spatial resolution of satellite image which specifies the size of the pixel in an image in addition to in the spectral resolution of the electromagnetic wavelength region that records the reflectance from ground features to produce higher-resolution images. These systems are capable of producing information about the smallest separable feature located on the earth’s surface. The information captured through this system is stored in pixels. Every single pixel has a specifi c digital number ranging between 0 to 255 wherein 0 represents no or minimum light and 255 represents very bright or maximum light radiated from an object.
Oman (2011) emphasized the benefits of geo-spatial techniques and provides solutions to resolve the associated issues and their causes related to vegetation cover. A study by Rai et al. (2016) emphasized that land cover / land use change detection is a vital for sustainable planning and for managing land and other natural resources. Pattanayak and Diwakar (2016) defined land cover as the actual surface cover utilized by vegetation, buildings, or water bodies. Such features or objects could be observed or monitored through a remotely sense system. Tamilenthi and Baskaran (2013) deliberated upon the various social, economic, cultural, administrative, and chronological factors affecting changes in land surface of area of interest. Such explanations demand the procurement of higher resolution satellite imageries.
Necessity of change detection
Change is inevitable and reliable change detection techniques provide information about the areas of change, the pace of change and types of change. The growth and development of necessary social, economic and physical infrastructure in the limited available space bring major changes to the land. Chen (2002) emphasized the role of land cover / land use planning in regional and socio-economic development, which has lately been acknowledged as a vital instrument for measuring changes in the land cover. A sound knowledge of the technology and its usage is a prerequisite for data handling and for performing the change detection analysis. Recently, Zhou et al. (2011) examined the reversible and irreversible land cover / land use changes and also identified the factors responsible for such changes. Several techniques and methods are available to detect spatial changes on the land surface; these have some advantages and limitations.
Moreover, the peculiarity of a place can be ascertained through its location, morphology, vertical profile, spatial pattern, socio-economic functions, environment, and government and private institutions. All these aspects are interrelated and interdependent on each other, based on the nature of their interaction. It is often possible to determine these changes using the census data on population; however using the spatial technology and remotely sensed data, such spatial changes can be determined to check the situation on ground conditions as well as useful for making future growth trends and potentials.
Overview of change detection techniques
This section presents a comprehensive study of various techniques and approaches, including their advantages, limitations and relevance in planning studies. An effort has been made here to exploit the potential of geospatial technology to demonstrate its relevance and application particularly in spatial or regional planning through a case study. Here, we shall look at the three salient indices of land cover change indices: Vegetation Index, Water Index and Built-up Index.
Vegetation Index or Normalized Difference Vegetation Index (NDVI)
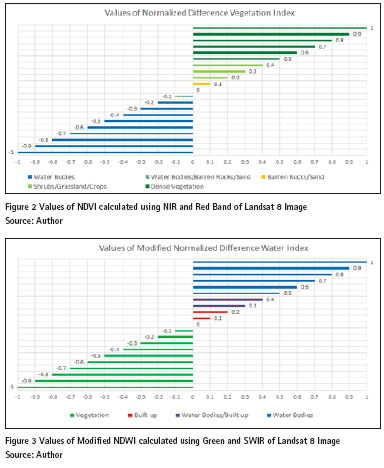
The vegetation index examines the relation between spectral wavelength changeability and the vegetation growth. To compute the vegetation index, red spectral band and near infrared spectral band are used due to their absorbance and refl ectance properties. Tucker (1979) presented a detailed study by observing the linear combinations between the visible red spectral band and near infrared spectral bands. He concluded that, such linear association between red band and photographic infrared bands provides information that is highly essential to monitor the photo-synthetically active biomass of plant canopies. NDVI values range from -1 to +1. Zhou et al. (2011) expressed that higher NDVI values imply healthier vegetation condition, wherein NDVI values less than or equal to zero represent land with low or no vegetation cover or bare land. The lower value of indices also represents drought condition or water scarcity in the region.
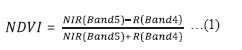
In the given NDVI equation, the refl ectance values of red band need to be subtracted from the refl ectance values of near infrared band (NIR) and then divided by the submission of the above mentioned bands (Paul and Florian, 2017). In the given equation (1), Landsat 8 data of Band 4 (red) and Band 5 (NIR) are used.
Water Differencing Index or Normalized Difference Water Index (NDWI)
The Water Differencing Index has been formulated to distinguish water features from the remotely sensed imagery using the near infrared band and visible green band light (Zha et al. 2016). In 1996, McFeeters derived information on water bodies employing the Band 3 of Landsat 8 and Band 6 of Landsat 8 bands due to high optical density and low refl ectance in the near infrared band and beyond. NDWI values range from -1 to +1. Higher NDVI values imply presence of water bodies, wherein NDWI values ranging from less than 0 to -1 represent land with low or no vegetation cover or barren land. The NDWI can be formulated using the equation (2).
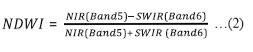
However, the results of the index couldn’t manage to provide the desired results. To redress the issues, Xu (2005) developed modifi ed water index using the green and shortwave infrared bands from electromagnetic wavelength region. In the equation (3) below, Band 3 and Band 6 of Landsat 8 are used. The water index value ranges between -1 and +1. The modifi ed water index was computed using the equation (3). To understand the indices values of modifi ed water index, the resulting value of greater than 0.5 represents presence of high amount of water in the region.
![]()
Index Base Built-up or Normalized Difference Built up Index (NDBI)
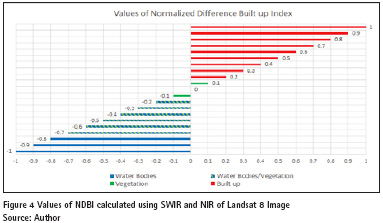
Urbanization is a dynamic concept, more commonly referring to a process of transformation that leads to urban sprawl. Serious efforts are being made to map such sprawl and analyze their patterns of growth. Historical archives have been given considerable recognition in mapping and assessing the urban sprawl that occurs over a place at a particular period of time (Bhatti and Tripathi, 2014). Zha et al. (2016) presented an index for mapping rapid and accurate changes resulting from urbanization. In today’s context, satellite based systems have proven to be an invaluable resource for mapping built up areas and providing a comprehensive view of larger areas. The NDBI index is computed using the Band 6 and Band 5 of Landsat 8 respectively (Kaplan et al. 2018). In the equation (4) below, Band 5 and Band 6 of Landsat 8 are used. NDBI values range from -1 to +1. Positive values of the NDBI imply presence of built or hard surfaces and negative values represent presence of water bodies, and values in between imply the presence of vegetation. Generally, the resultant values of built-up features range from 0 to 0.2.
![]()
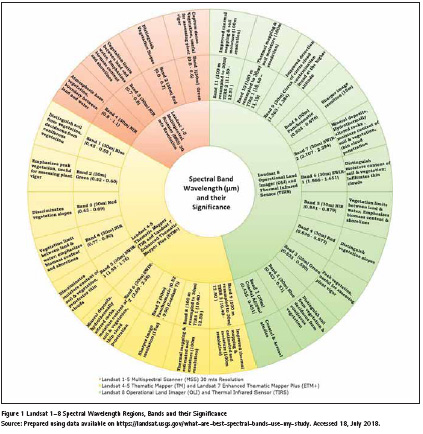
The fi g.1 provides an overview of spectral bands, their resolutions, bandwidths and their uses. Practically, the usage of band combination for performing change analysis is slightly complicated, as the wavelength region of each Landsat band is different. Primarily, Landsat 1-5 and multispectral scanners capture objects using four spectral bands. Subsequently with improvements in spectral wavelength regions the Landsat 4, Landsat 5, Landsat 7, TM and ETM-1 capture objects’ information through nine bands. Following the consecutive developments in the sensor technology, Landsat 8, OLI, and TIRS has allowed satellites to capture objects on land through eleven different spectral bands.
The fi g.2, fi g.3 and fi g.4 shown below illustrate the indicative values representing various features of land and water, and vegetation in particular. The values may vary due to spectral enhancements, reflectance and absorbance properties of an object at the time of capturing the image through camera installed on satellite. At times, deviations occur due to temperature variation, seasonal variation, time and most importantly, the location of an area. To measure the accuracy of the results, we also need to exercise other relevant techniques.
Study methodology
The subsequent section covers the description of the case study area, data procurement methodology and spatial data analysis techniques. Selective techniques and methods have been used here to demonstrate the potential of satellite data and GIS software for carrying out regional scale studies. NDVI, MNDWI and NDBI maps have been generated using the given equations in ArcGIS software.
Introduction to case study
Surat is the second most populated district in Gujarat state after Ahmedabad and it covers an area of 4,549 sq. km—2.32% of Gujarat’s total area according to 2011 census records. The district has experienced 42.24% population growth from 2001 to 2011. The district had a total population of 60.81 lakhs in 2011 and a density of 1337 persons/ sq. km, which had been almost half in the previous decade. The urbanization level in the district has increased from 60% in 2001 to 79.74% in 2011. Presently, the district consists of 10 talukas, 8 statutory towns, 14 census towns and 713 villages.
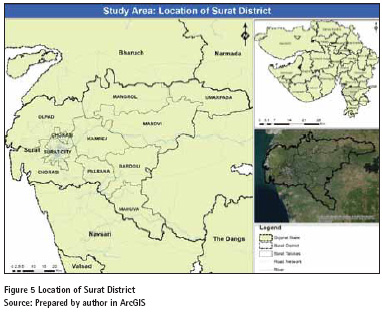
The district is geographically the part of Gujarat Plains and located in the south between the 20.81o to 21.58o North Latitudes and 72.61o to 73.71o East Longitudes. It has seven sub micro regions following climatic zones, topography, geological features, natural vegetation, and soils types. The district has minor hill ranges belonging to the Deccan Peninsula’s western coastlines. The main Sahyadrian range is located slightly outside the limits of the district. The district is surrounded by the tapi district in the east by the Bharuch and Narmada districts in the north by the Navsari district in the south and the Khambhat gulf.in the west. There are four main rivers in this district: Tapi, Kim, Purna and Ambika. Among them, the Tapi River is the largest perennial of the district. The map (fi g.5) shows the location of case study area.
Resources and material
Several steps, including data procurement, generation, processing and analysis, were performed. The ArcGIS software was used to digitized the study area map; the spatial analysis was conducted on satellite images downloaded from the United States Geological Survey (USGS) earth explorer, which is an open source website where one can download georeferenced and nongeoreferenced satellite images for research and academic purposes. The vector data layers were generated using the digitization or geoprocessing tools available in the ArcGIS software. The process of vector data creation is known as digitization. Some open source websites allow you to download or provide already digitized layers of various features. In the present study, the shape fi les of Surat district up to the taluka level and the associated physical features were extracted from Open Street Map and DIVA-GIS. Since, both raster images and digitized vector layers were obtained from different platforms, standard accuracy has been ensured using functions and tools such as georeferencing and redefining projection; raster processing includes mosaic raster, composite bands, and clip, and spatial analysis includes the raster calculator and related tools and functions.
For assessing change detection, satellite data from Landsat 8 Level-I was obtained from the USGS earth explorer site. Creating a user login ID is a prerequisite for obtaining data from USGS. The study is based on the approaches used for feature extraction—the NDBI, the NDVI and the NDWI. For the present study, satellite images from May 2015 and May 2018 were procured and have been used for a detailed analysis for assessing the changes in the objects on the earth’s surface. Prior to analysis, all the scenes of study area were mosaicked to create one single image of an area. These images were then clipped using the vector layer of the Surat district boundary to extract the study area.
Spatial analysis of indices
The present study investigates the changes in the main components of land cover i.e. vegetation, water and built-up space, over four years. Processed images were used to conduct spatial analysis for constructing the NDVI, NDWI and NDBI indexes, which ensure the timely provision of information required for planning and management of human and natural resources.
Normalized Difference Vegetative Index (NDVI)
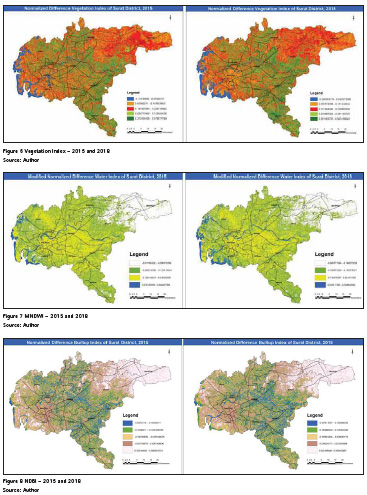
In ArcGIS, several methods are available for determining the changes in vegetation cover. The NDVI of Surat district was generated through the ArcGIS Spatial Analyst raster calculator tool that uses Map Algebra as its analysis language. The tool helps you to insert the NDVI function and generates a new image displaying the intensity of vegetation cover. The resulting NDVI image (fi g.6) represents the vegetation change between 2015 and 2018. The trifl ing changes in the brightness values of vegetation cover between the two periods is be due to noises in the atmosphere, even after the radiometric normalization of the satellite images (Sharma and Jalan 2013). The results indicates high vegetation cover in the Kamrej, Bardoli, Mangrol, Olpad, and Mahuva talukas due to the presence of large agricultural fields, shrubs or barren land. The colors in Fig. 6 represent the respective features on the land surface. Green represents vegetation; red shows built-up areas; and blue shows water. The zero values indicate no-change areas; negative values represent the reduction in vegetation density; and positive values indicate high vegetation density. The classification of these images reveals the apparent change in the pixel values of the resultant NDVI images. Ideally, the pixel values of vegetative index ranges between 0.2 and +1, which includes shrubs, grassland, cropland and dense vegetation. There was a substantial decline in the NDVI values over the last five years from 0.224 to +0.578 in the year 2015 and from -0.326 to +0.563 in 2018. From this, it can be concluded that there was a decrease in vegetation cover from 2015 to 2018.
Modified Normalized Difference Water Index (MNDWI)
The result from the MNDWI analysis depicts the increase in water bodies around the coastal belt of Surat district over the last fi ve years. However, the values of water index range from -1 to +1, and values greater than 0.5 represents the water features. Likewise, colors have been chosen appropriately to represent the features present on the land surface. The existing analysis was done using the Band 3 and Band 6 of Landsat 8 to extract the water features. The MNDWI of Surat district was generated using the ArcGIS Spatial Analyst tool available with spatial analyst extension.
The resulting MNDWI images (fi g.7) highlights the changes in water bodies from 2015 to 2018. The classification of MNDWI image revealed changes in the values of the water index from 0.560 in 2015 to 0.529 in 2018.
Normalized Difference Built up Index (NDBI)
Likewise, the NDBI of Surat district was generated using the same tool available in spatial analyst. The Landsat 8 satellite data, particularly the Band 5 and Band 6, were used to determine the changes in the built up space of Surat district. Generally, negative NDBI values represent water bodies and higher values (towards +1) represent intensive built up areas. The values on the lower side represent vegetation. In the present case, the values of NDBI images were classified to highlight the changes in built up area during the two respective years. The resultant images clearly reveals the increase in built up space from 2015 to 2018 (fi g.8). The changes in built up index between the two periods indicates the increase of built up space particularly in Surat city. This is due to the fact that, nearly 80% of the district population lives in the city, according to the 2011 census, resulting in a population density of 13500 persons per sq. km. Known as a dynamic city and a major employment center with several manufacturing industries the city attracts migrant population from the nearby district or states.
Spatial Indices and their Application
The NDVI index helps in monitoring the changes in vegetation densities. It is also useful for determining the distribution of specific features, such as water bodies, transport networks, settlements, agricultural land and concrete structures. The MNDWI index allows the monitoring of changes in water bodies. It helps in effectively enhancing and assessing the surface water features in terms of quality and quantity. It further reduces or removes the vegetation and soil cover noise, thus enhancing the water features. The NDBI index aids in monitoring the changes in built up area. Nonetheless, these observations only provide a general viewpoint. The actual application and utility depend fairly upon the study area under consideration and are further subject to field studies.
Conclusions
The above regional-level study very effectively exhibits the utility of geospatial technologies. However, in case of urban areas, the accuracy of the results could be further ground-tested by fi eld verification. This is required because the equations used to determine these indices uses spectral bands information that enhances certain specifi c feature and show the slight changes in the reflectance and absorbance properties of any object. Such errors or a change in the spectral values of any objects needs either technical correction on the image itself or through field verification.
The discussed techniques are highly beneficial for the preparation of regional/ district plan, development plans, land suitability analysis and environmental studies. These studies are sometimes expensive in terms of both time and money, because they require high-end hardware and software, followed by extensive fi eld surveys. Nonetheless, such studies could be conducted or verified through other available techniques, such as, supervised classification and accuracy assessment. The need of the hour is to acquire an in depth understating of the application of these geo-spatial tools and techniques.
References
Allan, J. (1980). Remote sensing in land and land use studies. Geography, 65(1), 35–43. Retrieved from http://www.jstor.org/stable/40570273 /
Azmi, R., Bachir Alami, O., Errahim Saadane, A., Kacimi, I., & Chafi q, T. (2016). A modifi ed and enhanced normalized built up index using multispectral and thermal bands. Indian Journal of Science and Technology, 9 (28):1–10
Barsi, J., Lee, K., Kvaran, G., Markham, B., & Pedelty, J. (2014). The spectral response of the Landsat-8 operational land imager. Remote Sensing, 6(10), 10232– 10251. DOI: 10.3390/rs61010232
Bhatti, S. S. & Tripathi, N. K. (2014). Built up area extraction using Landsat 8 OLI imagery, GIScience & Remote Sensing, 51(4), 445– 467. DOI: 10.1080/15481603.2014.93953
Chen, X. (2002). Using remote sensing and GIS to analyze land cover change and its impacts on regional sustainable development. International Journal of Remote Sensing, 23, 1, 107–124. DOI: 10.1080/01431160010007051
District Census Handbook, Surat, Census of India (2011) Village and Town wise Primary Census Abstract, Series-25, Part XII-B, Director of Census Operation, Gujarat
District Census Handbook, Surat, Census of India (2001) Village and Town wise Primary Census Abstract, Series-25, Part XII-A&B, Director of Census Operation, Gujarat
Kaplan, G., Avdan, U., & Avdan, Z. Y. (2018). Urban heat island analysis using the Landsat 8 satellite data: A case study in Skopje, Macedonia. Proceedings, 2(7), 358. DOI: 10.3390/ecrs-2-05171
Macarof, P. & Statescu, F. (2017). Comparison of NDBI and NDVI as indicators of surface urban heat island effect in Landsat 8 imagery: A case study of Iasi. Present Environment and Sustainable Development, 11(2), 141–150. DOI: 10.1515/pesd-2017-0032
Oman, G. (2011). The use of remote sensing & geographical information systems to identify vegetation: the case of Dhofar Governorate (Oman).
Pattanayak, S. & Diwakar, S. (2016). District wise change analysis of land use-land cover in Delhi territory using remote sensing and GIS. Journal of Urban and Environmental Engineering, 10(2), 201–213. Retrieved from http://www.jstor.org/stable/26203459
Rai, P., Vishwakarma, C., Thakur, S., Kamal, V. & Mukherjee, S. (2016). Changing land trajectories: A case study from India using a remote sensing based approach. European Journal of Geography, 7, 63–73.
Sharma, K & Jalan, S. (2013). Change assessment of urban green spaces of Dehradun city using image-derived parameters. Transactions of the Institute of Indian Geographers, 35, 63–74.
Sivakumar, R. (2010). Image interpretation of remote sensing data. Geo-spatial World. https://www.geospatialworld.net/author/ geospatialworld/ Accessed 25 July 2018.
Tamilenthi, S., & Baskaran, R. (2013). Urban change detection based on remote sensing and GIS study of Salem revenue division, Salem district, Tamil Nadu, India. European Association of Geographers, 4(3), 50–59.
Tucker, C. J. (1979). Red and photographic infrared linear combination for monitoring vegetation. Remote Sensing of Environment, 8, 127–150.
Zha, Y., Gao, Y. and Ni, S. (2003). Use of normalized difference built up index in automatically mapping urban areas from TM imagery. International Journal of Remote Sensing, 24, 583–594.
Zhou, Q., Li, B., & Chen, Y. (2011). Remote sensing change detection and process analysis of long-term land use change and human impacts. Ambio, 40(7), 807–818.


 (7 votes, average: 4.29 out of 5)


Leave your response!