| Mycoordinates | |
Educational library of GNSS signals for navigation
|
||||||||||||||||||||||||||||||
|
The current panorama of navigation satellite systems is rich of proposals for novel modulations and bands, to be prospectively used in the current and incoming systems. In this perspective, the know-how on the inherent nature of signals and systems is a fundamental resource to proactively cope with the multiple aspects of interaction and integration among signals, services and applications. Aside to the fundamental theoretical analysis, rooted onto the mathematical description and resolution of problems, the main tool in the researchers’ hands is nowadays computer-aided simulation. For this reason, a plethora of GNSS system/signal simulators has been created worldwide, from home-made very simple signal simulators to professional, complete and very expensive, system emulators [1]. This paper presents a MATLAB®-based simulator designed to offer a fl exible but complete tool able to off-line reproduce GNSS signals at the ADC (Analog to Digital Converter) output of a navigation receiver, either at intermediate frequency (IF) or at baseband (BB). The signal generator can account for the effects of multipath, Doppler, interferences of different nature (i.e., intra-system, intersystem, bandlimited, continuous wave, etc…) on all the bands of interests for the future GNSS, as well as AWGN (Additive White Gaussian Noise) and receiver frontend characteristics (equivalent receive filter, ADC). Thereby, a reliable, though nonreal time, simulation of the received signal samples after ADC conversion is made available at a sampling frequency open to the user’s setting. This allows the test of any reception algorithm that processes digital samples in a completely controlled signal/environmental scenario, e.g. acquisition algorithms, code and carriers tracking loops, C/N0 estimation algorithms, interference or multipath detection and mitigation algorithms and so on. The signal generator is only a part of a more complete signal generation and analysis tool called N-FUELS (FUll Educational Library of Signals for Navigation), which includes also a set of signal analysis functions for testing and monitoring several signal metrics: for example, power spectral density estimation applied either to the signal generator output or to any sample stream at the IF or BB stages, group delay estimation associated to a certain receiver confi guration, discriminator curves, multipath error envelope and running average curves, spectral separation coeffi cients, etc… For these reasons, the tool represents an appealing, low-cost, quick instrument for a wide variety of educational and research analyses that can be developed and performed onto GNSS signals. The relevance of the tool can be individuated in its software modularity and then versatility, its use easiness, being a collection of MATLAB® modules, and its incomparably low cost with respect to other hardware devices on the market, undoubtedly traded off with off-line processing and comparatively long simulation times.
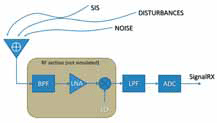
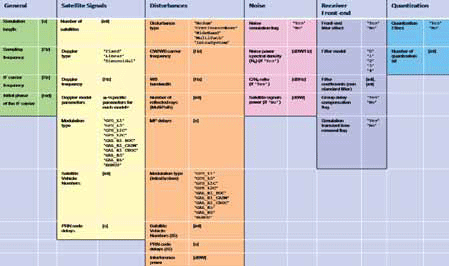
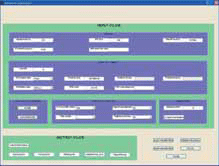
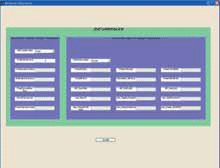
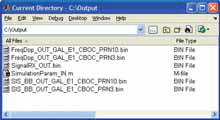
Figure 1. System elements simulated by the signal generator. The output are the samples of the digitalized signal at the receiver (‘SignalRX’). Signal Generation ToolThe MATLAB®-based N-FUELS signal generator allows simulating the physical level signal structure of GPS, Galileo, and EGNOS systems in all the current and future bands (L1, L2 and L5 for GPS, E1, E5 and E6 for Galileo), as seen at the front-end output of a digital receiver,right after analog-to-digital conversion. The signal samples are possibly impaired by noise and/or interference, multipath and Doppler effect, and can carry the navigation message read from an adhoc fi le. A conceptual scheme of the elements included in the signal generator is sketched in Figure 1, where • ‘SIS’ indicates the generation of the Signal-In-Space (SIS) for one or more satellites; • ‘DISTURBANCES’ indicates the generation of the disturbing signals (e.g., interference or multipath); • ‘NOISE’ indicates the generation of the AWGN. In order to guarantee use versatility and fully controlled simulation conditions, the user is allowed to set a wide range of simulation parameters, reported in the six panels of Figure 2: general simulation parameters, defi nition of the SIS components, interference/multipath scenario, thermal noise, receiver frontend model and quantization bits. For the disturbances scenario, in particular, the user can select the type of disturbance affecting the SIS, among Continuous Wave (CW) or wideband interference (WB), multipath (MP), and intra/ inter-system interference (IS). The latter represents the case where one or more “desired” SIS are subject to the interference from other GNSS signals, from the same or another constellation among GPS, Galileo and EGNOS. All the parameters can be set by a graphical user interface (GUI, Figure 3), which allows a quick and intuitive introduction of signal, noise and disturbance characteristics. An example of the output directory produced by the signal generator is shown in Figure 4, where it is possible to observe: • the presence of the binary file containing the signal samples at the ADC output (output fi le ‘SignalRX_OUT.bin’), • the simulation parameters file (‘SimulationParam_IN.m’), • the fi les containing the SIS PRN codes (one fi le for each satellite, e.g., ‘SIS_BB_OUT_GAL_E1_CBOC_ PRN10.bin’, for the PR sequence 10 of Galileo in the E1 band), and • the files containing the sequence of values of the Doppler frequency shifts (one file for each satellite, e.g., ‘FreqDop_OUT_GAL_ E1_CBOC_PRN10.bin’).
Figure 2. Signal generator. User’s settings panels.
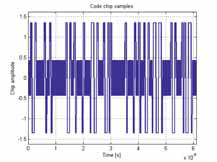
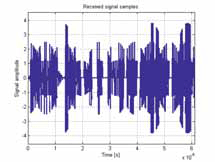
Figure 3. (a) Main window of the signal generator’s GUI; (b) disturbances panel. The stored code samples are shown in Figure 5(a), drawn with 16.3676 MHz sampling frequency, while the corresponding IF modulated signal, at fIF = 4.1304 MHz, is shown in Figure 5(b)
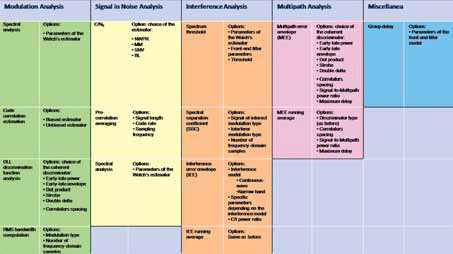
Figure 4. Signal generator. Output files. Signal Analysis ToolThe signal analysis tool contains several routines able to perform a detailed analysis of navigation signals, thus acting as a set of software instruments enabling to perform a modular and homogeneous “check-up” of the characteristics of every GNSS signal as received by a digital receiver. Homogeneity is desirable in the sense that the set of instruments emulated by the tool functions operates as a sort of jointly-calibrated toolbox, guaranteeing a complete agreement of the results obtained from different measurement functions, so that they can be related, compared and possibly inferred to one another. Modularity, on the other hand, is another desirable characteristic, enabling a very fl exible software architecture made of independent blocks that can be added or removed from the current signal analysis without impacting on the functionalities of the whole tool. The natural input of the signal analysis tool is evidently the output produced by the signal generator, but it is not limited to that: any sequence of samples generated by a digital receiver can be off-line processed by the signal analysis tool, once the correct information about the employed receiver setup is passed to the software modules. The functionalities inserted into the tool account for a signifi cant portion of the whole family of measurements commonly employed in the fields of GNSS signal analysis and GNSS digital receivers. They can be assigned to fi ve logical panels, as reported in Figure 6: Modulation analysis, including spectral analysis, code correlation estimation, DLL discrimination function analysis, RMS bandwidth computation. This set of functions is intended to measure the intrinsic characteristics of a given modulation. For this reason, these measurements are not observable in a real receiver, but they are obtained in simulation from the noise-free and impairment-free signal samples generated by the signal simulator. Signal-in-noise analysis, including C/ N0 estimation, pre-correlation averaging [2], and spectral analysis. This set of functions replicates some of the functionalities a signal receiver can implement. These functions are dedicated, but not limited, to the analysis of satellite signals buried in thermal noise. Interference analysis, including spectrum threshold, Spectral Separation Coeffi cient (SSC), Interference Error Envelope (IEE). SSC is a widely recognized theoretical method to analyze the expected interference impact on a given modulation [3], while the interference error envelope is a novel metric that allows a more detailed analysis of specific interference parameters, taking into account also the receiver setup [4,5]. Both SSC and IEE are numerical evaluations of analytical formulations; on the contrary spectrum threshold is a simple detection method that exploits the noise-like spectral property of the received signal-in-noise, opposite to the interference spectrum, generally much higher than the background noise. Multipath analysis, including multipath error envelope and running average [6], implemented for different discrimination functions. Miscellanea, including group delay estimation, measured on the basis of the digital model of the front-end fi lter. For each function, a specifi c set of open parameters allows the user to select and refi ne his/her “virtual test-bench” setup (see Figure 6).
Figure 5. Signal generator. Output samples: (a) Galileo E1-B-C CBOC chips; (b) modulated samples @4.1304 MHz IF frequency with linear Doppler model.
Figure 6. Signal analysis tool. User’s settings panels.
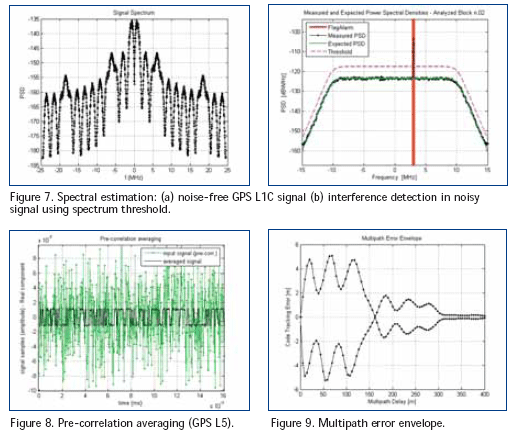
Analysis of received signalsTwo examples of spectral analysis realized with the tool are shown in Figure 7. In part (a), the power spectral density of the TMBOC signal (GPS on L1C band) is shown, while in part (b) the same signal is analyzed in the presence of AWG noise (C/N0 = 40 dBHz) and a CW interferer appearing with -30 dB signal-tointerferer power ratio. The spectrum threshold function allows detecting the presence and the spectral location of the interferer, thanks to the fact that, in the presence of AWGN, the signal spectrum is completely buried into the noise so that the resulting power spectral density is shaped by the front-end transfer function. The interferer is identifi ed by the red vertical stripe. In Figure 8, averaging of directly observed precorrelation signal samples [2] is applied to a GPS L5 signal in noise (C/N0 = 65 dBHz). As it is possible to observe, the code waveform can be recovered from the superposition and average of a large set of noisy samples (1.82 seconds of simulated samples, at the sampling rate 40.92 MHz). Only the real component is shown in the fi gure. Finally, an example of multipath analysis for the Galileo CBOC signal on the E1 band is reported in Figure 9, based on the multipath error envelope computed for a dot-product discriminator (0.1 chip spacing) and a receiver bandwidth of about 20 MHz. ConclusionsN-FUELS in a toolbox of MATLAB® modules for in-lab generation and analysis of all GPS and Galileo signals today in use (or in perspective use). Its relevance for educational and research activities appears in the fact that it prevents the user to deal with a wide variety of problems related to the realistic simulation of satellite signals (e.g., PRN codes and modulations), environmental effects (e.g., Doppler shift of the carrier frequency and on the code, Doppler rate, multipath), interference, and receiver effects (e.g., received thermal noise, front-end fi lters, incommensurable sampling frequency, quantization), still maintaining an extreme versatility in the defi nition of scenarios. Furthermore, it offers a set of the most common signal analysis procedures used to monitor the quality and performance of GNSS signals, thus complementing the signal generation tool with a modular and homogenous analysis tool. The N-FUELS toolbox has already been fruitfully and successfully used in several simulation campaigns to test and validate various receiver architectures and algorithms [4, 5, 7-11], as well as an educational tool for post-graduate students. References[1] J.-H. Won, T. Pany, G. W. Hein,“GNSS software defi ned radio,” Inside GNSS, July/Aug. 2006. [2] M. Pini, D. M. Akos, “Exploiting global navigation satellite system GNSS signal structure to enhance observability,” IEEE Trans. Aerospace and Electronic Systems, vol. 43, no. 4, pp. 1553-1566, Oct. 2007. [3] B. M. Titus, J. W. Betz, C. J. Hegarty, and R. Owen, “Intersystem and intrasystem interference analysis methodology,” ION GPS/GNSS 2003, Sept. 2003. [4] B. Motella, S. Savasta, F. Dovis, D. Margaria, “An interference impact assessment model for GNSS signals,” ION GNSS Conference, Sept. 2008. [5] B. Motella, S. Savasta, D. Margaria, F. Dovis,“A model for assessing the interference impact on GNSS receivers,” submitted to IEEE Transactions on Aerospace and Electronic Systems, Jan. 2009. [6] M. Irsigler, J. A. Avila-Rodriguez, and G. W. Hein, “Criteria for GNSS multipath performance assessment,” in ION GNSS ITM 2005, Sept. 2005. [7] E. Falletti, M. Pini, L. Lo Presti, D. Margaria,“Assessment on low complexity C/N0 estimators based on a M-PSK signal model for GNSS receivers,” in IEEE/ION PLANS, May 2008. [8] E. Falletti, M. Pini, L. Lo Presti, “Low complexity carrier to noise ratio estimators for GNSS digital receivers,” submitted to the IEEE Trans. On Aerosp. and Elec. Sys., June 2008. [9] B. Motella, S. Savasta, D. Margaria, F. Dovis, “Assessing GPS robustness in presence of communication signals,” in International Workshop on Synergies in Communications and Localization, SyCoLo, June 2009. [10] M. Pini, B. Motella, D. Margaria, E. Falletti, “SDR technologies supporting RF signal power calibration in GNSS receivers testing,” in ION GNSS Conference (submitted), 2009. [11] A. Molino, M. Nicola, M. Pini, M. Fantino, “N-Gene GNSS software receiver for acquisition and tracking algorithms validation,” in 17th European Signal Processing Conference, EUSIPCO (submitted), 2009. |
||||||||||||||||||||||||||||||
|
||||||||||||||||||||||||||||||
|




 (No Ratings Yet)