| Mapping | |
Digital elevation models based on the topographic maps
This article focuses on the technology of creating a digital elevation model (DEM) with the help of the geographic information system (GIS) |
 |
|
 |
|
 |
|
This article focuses on the technology of creating a digital elevation model (DEM) with the help of the geographic information system (GIS). The geodetic measurements, topographic maps at a scale of 1:500 000, remote sensing, GNSS data and Central Asian Tectonic Science (CATS) are used for creating of DEMs. The advantages of the GIS in comparison with traditional methods of creating maps are given in this work. The ways for use of the European Remote- Sensing Satellite (ERS1) and the Synthetic Aperture Radar (SAR) for creating of the digital map of the Tashkent region are described. Development of digital terrain models using GIS PANORAMA for 4 regions of Uzbekistan is described in more detail. The analysis of the trajectory of the ERS1 during the passage to the territory of Uzbekistan was also made.
From the perspective of the development of the Global Geodetic Reference Frame (GGRF) Uzbekistan’s commitment envisages the further improvement the national geodetic infrastructure. The goal is to develop spatial data in accordance with required accuracy and to contribute to the development of an accurate, accessible and sustainable GGRF. In this country, the development of homogeneous distribution of geodetic infrastructure is related to the upgrading the reference system and Datum, the cartographic projections for topographic maps. Data sharing is also limited because of not well defined geodetic standards and an absence of open geodetic data. This paper covers only one of the issues of the development GGRF and Global Spatial Data Infrastructure.
In 1980-1990, information about the terrain was recorded on the national topographic maps. The information was obtained on the basis of geodetic measurements (triangulation and leveling), aerial surveys and optical remote sensing. Currently, these maps must be corrected and improved because of deformation of the coordinate grid due to global and local plate shifts. First of all, this refers to the mathematical basis of the maps. Accurate topographic maps are in need not only to navigate, but also to indicate geometric relations between points of landmarks depicted on the map, to display information on areal extent of different land use, to design large infrastructure and transportation problems, and so on. They will be in demand for a long time and can be used as an addition to digital maps. A refined rectangular and spatial coordinate system is a base for development of an accurate digital map and a digital elevation model. A spatial reference system defines the coordinate system and Datum in which all landmarks have a unique “address” or position.
Many areas of the world are poorly or insufficiently mapped, and any existing information is often out-of- date. Additionally, the rapidly growing market for GIS has increased the demand for digital maps. These trends have led to the wide spread use of optical satellitederived information. With the introduction of the GIS, the foundation of which is software and digital map, the situation has changed significantly due to the use of digital terrain models based on modern imagery, satellite navigation systems. The progress of the development of technology in remote areas of the Earth causes the demand for modern digital maps. Digital elevation models with support of GIS are used to solve applied problems in mapping. In particular, there is the need to assess the accuracy of the model and the choice of the optimal DEM when analyzing the terrain from many digital maps of various scales and methods of obtaining them. GIS takes on special significance, since it is oriented to work with digital cartographic information, which is necessary for coordinate-time binding of objects and used in the planning of construction. A complete replacement of paper maps with digital ones does not happen despite the growing role of digital maps, which form the basis of GIS. It is only about their joint use and complementation of each other. The capabilities of modern programs allow not only to create a digital map, but to recalculate the coordinates of neighboring states. The construction of a three-dimensional model of relief depends on the accuracy of the heights and the scale of topographic maps.
The main sources of the digital elevation model are geodetic measurements, topographic maps, aerial survey data, laser scanning, the remote sensing and GNSS data. In order to use these data for construction of DEM, it is necessary to have special software or GIS. The GIS is multifunctional and flexible in use, which allows us to create not only 2D, but also three-dimensional models of terrain and topography. The basis for creating a digital elevation model is the values of the heights of contour lines on topographic maps, which are plotted by the photogrammetric method. The accuracy of these contour lines depends on the scale of source-map, the angle of the terrain slope, and the accuracy of the heights of the benchmarks obtained by the triangulation and leveling. The absolute heights of the surface points on topographic maps are indicated by the benchmarks, town survey marks, the trigonometric beacons. They are the orthometric heights obtained relative to the Baltic sea level (BSL), which has become a classic standard and will probably remain for a long time. These heights are normally obtained through spirit leveling, which is a very tedious and expensive process. Distortions in heights are mostly caused by periodic crustal deformations while the inconsistency between the BSL and geoid.
Since 1977, all heights on topographic maps are normal heights Hγ, which were calculated relative to the Molodensky quasigeoid. The relationship between orthometric height and ellipsoidal height (h) is given by H = h – N. Reduction of the normal height Hγ to the ellipsoidal height h is necessary to calculate the Gauss-Krüger cartesian coordinates in the case of seven transformation parameters determination. The orthometric height should never be given without stating the geoid model used. Different geoid models give different heights for a point, even though the ellipsoid height might be very accurate. The precise geoid model not only enables to convert ellipsoidal heights to leveled heights but also plays an important role in combining leveling data with GPS measurements to study vertical crustal movements for a longer period of time. The determination of heights using GPS is a long-term goal in surveying, in order to substitute time consuming and expensive differential leveling. It is necessary to modify the reference system of topographic maps taking into account modern requirements to accuracy. Another issue is to change the cartographic projection and to improve the origin of the zero point of the vertical component (Datum).
Additional reference frame
In 2018, Uzbekistan introduced the World Geodetic System 1984 (WGS84) instead of the coordinate system 1942 (SK42) for the geodetic works and town mapping. Due to the lack of digital maps in the new coordinate system, the outdated topographic maps are still in use. As long as the traditional coordinate and reference systems are still used along with the modern systems there will be need for translation of spatial data from traditional systems into the modern coordinate system (Molodensky and Helmert methods). This means that during the transition period there will be a high-volume data processing of geodetic datum shift coordinate transformations from traditional into the modern systems. There are a lot of soft for conversion of spatial data between various coordinate and reference systems. These programs are flexible to use, can perform calculations on large amounts of data quickly and with high accuracy. Users of these programs should be aware of the potential uncertainties, or errors, in computed heights when applying the software to convert values between two systems. If there are accurate initial data, then the results of the calculations will be correct. In the case of approximate parameters between two systems or the absence of them, then the use of the program is not correct. The result is that the relationship between two coordinate systems at the present time must also be observed on the ground, and this observation is subject to error as well. Therefore, only approximate models can ever exist to transform coordinates from one coordinate system to another. All national topographic maps were produced on the basis of SK42 in the Gauss-Krüger projection. As a transitional stage to the international coordinate system, it is possible to use existed topographic maps with the introduction of an additional coordinate network that is shifted by the difference between SK42 and WGS84. There are no digital maps in the new coordinate system, so it is necessary to improve the existed topographic map, taking into account modern requirements for accuracy and efficiency. Modification of the reference frame comprises updating the state vertical network and establishment national GNSS reference station. Additional reference frame based on modified Gauss – Krüger projection is more suitable for topographic maps at a scale of 1 : 25 000 – 1 : 100 000. The transition into the additional reference frame will help the surveyors and geodesists to use the existed and modern coordinates which are based on the two ellipsoids. Preliminary calculations of the difference in the coordinates of points between the two coordinate systems show that it increases depending on the scale of the map. These topographic maps with an additional coordinate grid will be used until modern digital maps for the whole country are created. Development of high-precision geoid and calculating the exact height on topographic maps is the foundation for the construction of DEM. One of the important construction parameters is the orthometric height on topographic maps obtained with respect to the geoid or BSL.
Methodology
DEM has three different components: computational model, network connection of nodes, representations with cells and this uses regular matrix of interpolated elevation data, which offers hierarchical classification of information depending on scale. A digital elevation model is a digital representation of a ground surface topography, and it can be represented as a raster (a grid of squares) or as a vector based triangular irregular network (TIN). Contour lines are lines that indicate elevation and the relief, which is in feet above BSL. The contour lines are obtained by cutting the terrain with equipotential surfaces in equal elevation distances and orthogonally projected on the basic equipotential surface. On map, regular contour lines are the thinner brown lines, index contour lines are the thicker brown ones. Creating and analyzing a TIN creates a huge strain on a computer system, and the smaller the area, the faster the processing speed. DEMs are commonly built using remote sensing techniques, but they may also be built from results of land surveying. These are used often in geographic information systems, and they are the most common basis for digitallyproduced relief maps. The terrain surface can be described as compromising of two different elements; random and systematic. The stochastic elements are the continuous surfaces with continuously varying relief. It would take an endless number of points to describe exactly the random terrain shapes, but these can be described in practice with a network of point. It is a common approach to use a network that creates sloping triangles or regular quadrants.
Observation and measurement
Geo-referencing to the high-altitude coordinate system helps defining coordinates of DEM. The state geodetic coordinate system is outdated and needs to be corrected and modernized. A digital elevation model should be geo-referenced to the international geodetic coordinate system. One of the most significant developments of the past few years has been the establishment of the International GPS Service for Geodynamics.
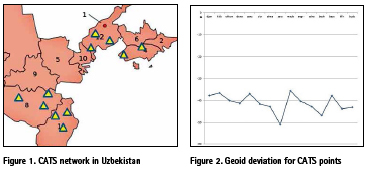
From 1992 to 1998, GPS measurements were carried out on the CATS project in order to study the distribution and accommodation of intraplate deformation in Central Asia for an improved assessment of geohazard (Fig. 1). The CATS project has a wider coverage and covers the region of Central Asia, although not the entire territory is covered by this network. (Fig.2). GPS receivers can measure ellipsoid height, some receivers use approximations of the geoid height to estimate the orthometric height from the geoid height. As an example, when using GPS receivers in the CATS project, the height of the geoid varied from -37 to -51m depending on the terrain.
The quality of the network geometry of the CATS network is in the order of 1- 3mm for horizontal components and about 5 mm for the height. This is derived from Helmert transformation between the daily solutions and the campaign solution. The global network accuracy is in the order of 1-2cm. Figure 3 shows the deviation values of the coordinates (in mm.) of the CATS project points on the daily solutions using the Helmert transformation.
The largest deviation in height is obtained for the stations “Angr” and “Adra”. This is due primarily to the fact that there are mines in these areas. Repeated measurements on these points will give an answer to the reason for the deviation of coordinates in height. The coordinates of these CATS points will be used to create a high-precision geodetic network. This starting configuration will be augmented by additional GPS stations in those areas where nothing exists, in order to obtain a more or less homogeneous data. Accuracy of computed geoid undulations depends largely on the extent of the terrestrial gravity anomaly data used around the computation point. In any gravimetric geoid computations at a regional or local level the gravity data is used only to a limited extent, therefore Stokes formula in its original form may not provide the desired solution. A precise geoid model is necessary for the establishment of a rigorous orthometric height system and unification of vertical Datum.

In 1996-1999, specialists from the Munich Center for the Study of the Earth implemented a project on remote sensing of Central Asia using the ERS1 and the SAR installed in Kitab, Uzbekistan (Fig.4). ERS1 imagery was used to generate high quality DEM using SAR interferometry; to provide thematic information on land cover including tropical areas; to improve localization of products complementing GPS measurements in remote areas; to rectify old or inaccurate maps or maps generated using other space data to high localization accuracy. From October 1998 to March 1999, the ERS-1 carried out remote sensing of the country with the help of the RA (Radar Altimeter) and PRARE (Precise Range and Range-rate Equipment). Since the ERS-1 has no receiving equipment, the PRARE receivers were installed on the ground. The ground station operate as `listen-only’ stations, using the oneway Doppler signal in S- or S/X-band and the broadcast satellite ephemerides for on-line position determination at the site (Fig.5). The relative positioning in centimeter accuracies which can be derived with help of these stations, in particular when tracking in an interferometric data, will be appropriate for many geodetic and geodynamic applications.
During the passage of the satellite over the territory, software was developed to predict its trajectory. In order to estimate the effect of Earth’s anomalous gravity field on particular satellite orbits, it is often sufficient to determine the accelerations caused by the first zonal harmonics. The dominant perturbing influence on the orbits of low artificial satellites is Earth’s noncentral gravitational field. In order to obtain high accuracy in orbit computations, which is necessary for most geodetic applications of satellite observations, it is necessary to estimate also the accelerations caused by atmospheric drag. For low orbiting satellites atmospheric drag also plays an important role. Therefore, there was worked out algorithmic program for calculation of ERS1 trajectory with taking into account of zonal harmonics J19 and atmospheric drag. There are calculated values azimuth (A) and elevation (h) of ERS1 trajectory during two weeks. The Figure 6 shows the deviation values in azimuth and altitude between the observation and the calculation (O-C)ΔA, Δh .
Calculation of ERS1 trajectory shows that the developed algorithmic program is correct and it is closed to the theoretical trajectory in short time for optical observation (Fig.7). The results of calculation show that the Earth’s geopotential and atmospheric drag significantly affect the satellite motion for altitudes from 200 to 800 km. And also with an increase in the number of zonal harmonics, the distance difference between the perturbed and unperturbed motion decreases.

Preliminary processing of remote sensing of this territory was carried out in Munich. Post- processing of this data was carried out with the help of the ERDAS soft and it is recorded on 83 CD at a scale of 1: 100 000. There is the first digital map of the Tashkent area based on the remote sensing (Fig. 8). Unfortunately, there is no grid system on the digital map.
Results
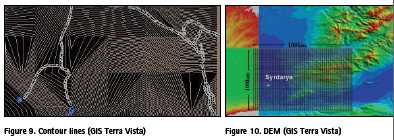
In 2000-2002, digital maps of ten regions were built by the MSIAC, USA with the help of GIS TERRA VISTA for maps at a scale of 1: 50 000. Terra Vista has possibility to import DTED0 level elevation data and VPF data from an open NGA data source and to create a Janus Terrain Database. Terra Vista is an advanced terrain modeling software that enables developers to generate correlated visual, sensor, SAF/ CGF, and analytical 3D databases. Providing the industry’s highest level of correlation, fastest production times, and most powerful production environment, Terra Vista includes all of the features in Terra Vista Base plus more output options and key integrations with productivity options. Developed digital maps with the help of Terra Vista were adapted for special studies. However, the images of the contours on these models did not correspond to the contours on the topographic maps, and more over they did not reflect the complete picture of the terrain where topography was performed (Fig.9,10). After a detailed analysis of these digital maps, it was suggested to improve the GIS Terra Vista taking into account modern requirements to the terrain.
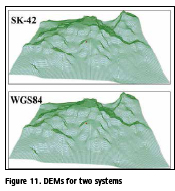
With the help of these GIS, the digital terrain model is presented in 3D with the ability to export in any format, as well as in the multimedia representation of the surface. Creating a 3D model does not require lengthy preparation; it is enough to have a 2D map and an elevation matrix. From these data, a threedimensional model of the terrain of the selected terrain may be built. To build a 3D terrain model, one can use: a vector map, a matrix of heights, a triangulation relief model, a map classifier, a library of threedimensional images of objects, digital photographs of the terrain and digital photographs of terrain objects. The main module for building a digital elevation model is the matrix of heights (Fig.11).
The matrix of the heights of the terrain is based on the information of map objects having an absolute height or a 3D. The matrix of heights is used in relief analysis, building profiles and visibility zones, calculating the length and area of objects with taking into account the characteristics of relief, calculating the volume of earthworks, modeling flood zones, determining the directions of slopes, forming a threedimensional map of the area and others.
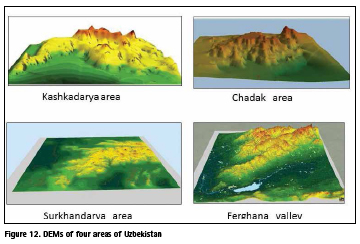
The results of creating a digital terrain model using the GIS PANORAMA are produced in the National University of Uzbekistan ( Fig.12). These areas are placed on topographic maps of 1: 500000 scale, which were scanned in raster format. Before digitizing this raster data, it is necessary to transform the raster image into the mathematical basis of topographic maps, taking into account all accuracy requirements. This procedure is performed more accurately and in detail in the national mapping agencies. In the process of digitization, raster and vector maps of the terrain are created for building DEM of some areas. The elevation were determined using not only contour lines on the topographic maps, but also all the additional information from the maps. The horizontal and vertical Datum of the DEMs is the SK42 and the BSL.
For comparison, digital models were developed in two coordinate systems, SK42 and WGS84. This will allow to analyze the geoid undulation for the gravitational field of the studied area. In the future, these data will be used to improve the digital terrain model and calculate the height of the quasigeoid. There is a slight difference between the two coordinate systems due to the choice of the scale of the topographic map and the terrain relief. The spatial difference of the digital models of the two systems can be obtained using large scale topographic maps.
The relief of Central Asia is heterogeneous and difficult to perform geodetic and cartographic works. Therefore, a digital model of the relief and terrain is only the preliminary information when it is built with the use of topographic maps. This can serve as a guide for reconnaissance of the terrain before creating a national digital model. Preliminary results of digitization of contours showed that the initial data of the topographic map needs to be corrected and edited, both in the situation and in generalization. In addition, it is necessary to use the results of the modern navigation surveys.
Conclusion
Thus, building elevation models by interpolating digital contours from topographic maps has its disadvantages. This is a hard work and this does not have enough satisfactory modeling accuracy. Despite these disadvantages, it is assumed that digitized topographic data will be used for a few more years. Construction a DEM provides an opportunity to create a national model of the relief.
The developed digital terrain models will be an example for building a digital model of the territory as well as detailed information for editing existing topographic maps. In addition, digital models in the border areas lead to the development of a unified system of coordinates for two or more republics. It can also be useful in the design of hydraulic structures and facilities where the mining takes place. This is especially important in areas where there are landslides and flooding. The developed results are used when conducting lectures and practical classes in higher educational institutions. The data can be used by cartographic organizations in the design of building structures near mountainous areas.
In the future, the use of the GOCE satellite data will provide more detailed information on the geoid, relief and water surface of the Aral Sea, as well as on the environmental protection.
Acknowledgement
The authors are grateful to MSIAC (USA) for providing digital maps of some regions of Uzbekistan, and also grateful to GFZ (Germany) for information about CATS. Special thanks to the masters Arabov O., Abdumuminov B. and Goziev I. for preparing digital elevation models.
References
Gulyamova L.X. (2008). Geoaxborot tizimlari va texnologiyalari. Darslik. Toshkent “Universitet”. (uzb). Mirmakhmudov E. (2017). Modification of the reference frame of Uzbekistan topographic maps based on the GNSS. Coordinates. 13(04).
Welsh R., Jordan T., Madden M.(2000). GPS surveys, DEMs and scanned aerial photographs for GIS database construction and thematic mapping of great smoky mountains national park . 2-International Archives of Photogrammetry and Remote Sensing. Vol. XXXIII, Part B4. Amsterdam.
Govorov M. (2008). Training material “ Geodesy and Cartography for needs of Geographic information infrastructure”. Vilnius.
Murayama Y., Estque C. Fundamentals of Geographic Information System. University of Tsukuba. 2010.
Patroba Achola Odera and Yoichi Fukuda. (2015). Recovery of orthometric heights from ellipsoidal heights using offsets method over Japan. Earth, Planets and Space. 67:134 DOI 10.1186/s40623-015-0306-z.
Mayorov A.N.(2008). Develop of technology and creating of quasi-geoid model based on the satellite data. Ph.D.tesis. Moscow. (rus).
Moritz H. (2000). Geodetic Reference System 1980. Journal Geodesy. 74: 128–133. Günter Seeder. (2003). Satellite geodesy. Germany.
Altiner Y.(1999). Analytical surface deformation theory for detection of the Earth’s crust movements. Spring-Verlag. Berlin. Heilderberg.
Harli Jürgenson , Aive Liibusk & Artu Ellmann. (2008). Geoid profiles in the Baltic Sea determined using GPS and sea level surface. Geodesy and Cartography. 34(4): 109–115. Vilnius.
Clifford J. Mucnier. (1998). Grid and Datum of the Republic of Uzbekistan. Photogrammetric engineering and Remote sensing. 1151.
Reighber Ch., Angermann D., Michel G., Klotz J., Galas R. & the CATSTeam. (1999). GPS constraints on the distribution of deformation of the Tien Shan, N-Pamirs and behavior of the Tarim. 14th Himalaya-Karakorum-Tibet Workshop. Terra Nostra, 127.


 (No Ratings Yet)


Leave your response!