|
In this paper accuracy investigation of MMS vehicle position correction process using GCP and development of accuracy maintenance method for MMS data at GPS Invisible Area are discussed. Readers may recallthat we published the fi rst part of the paper in June 2012 issue. We present here the concluding part
|
|
 |
Akihisa Imanishi
|
PASCO CORP.
|
MMS High Accuracy Information Center, Japan
|
|
|
 |
Kikuo Tachibana
|
Research and Development Center,
|
PASCO CORP, Japan
|
|
|
 |
Koichi Tsukahara
|
Technicaladvisor,
|
PASCO CORP, Japan
|
|
Accuracy investigation of LMU at GPS invisible period
Objective of accuracy investigation In this study, accuracy investigation of the corrected MMS measurement data by LMU and the mapping data derived from these corrected data were carried out to establish the most appropriate land mark point asignment (position intervaletc.) method at GPS invisible period. The target mapping scale is 1/500 and required accuracy is 25cm RMS for both horizontaland vertical.
Overview of accuracy investigation
Test field
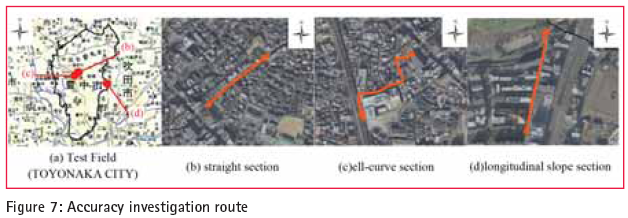
The accuracy investigation observation was carried out at TOYONAKA CITY in OSAKA prefecture.In Fig7. test route are displayed. One straight road is selected as standard test route. In addition, two other routes which includes ell-curve and inflection point of longitudinalslope were selected to check the influence of MMS vehicle motion (heading and pitching) in GPS invisible area.
Used MMS measurement data
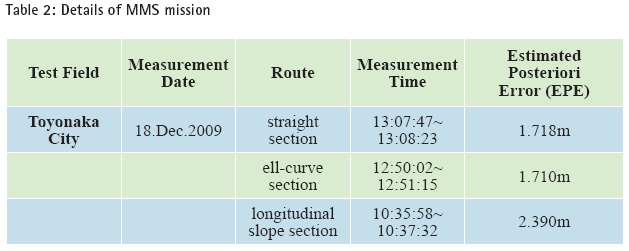
Details of MMS data used in accuracy investigation are shown in Table2. In order to verify the influence of intervalof land mark point and change of the MMS orientation (heading / pitch) reproduced data set of each routes where GPS positioning data was rejected manually and purely depending on the inertialpositioning by using IMU and odometer only was used.
Adoption of land mark
LMU corrects vehicle position using position correction vector which created from coordinates of land mark in the originalMMS measurement data and its ground surveying data (controlpoint coordinate value).Therefore selected land marks must be able to identify clearly in the imagery captured by MMS and the objects must be represented by laser point cloud absolutely. The objects selected as land mark are corner of the parcelline, manhole and corner of the gutter.
Ground coordinates observation of land mark
Ground coordinates of land mark was observed by network RTK-GPS (FKP method) and TS. 3D coordinates were observed. The accuracy levelof land mark coordinates refer to the 4th order controlpoint survey standard of Japan. In addition, some extra objects were also observed as check point to confi rm accuracy of corrected MMS measurement data by LMU and mapping data derived from it.
Accuracy investigation of LMU
Interval of land mark point
MMS vehicle position is calculated by GPS/IMU/Odometer data integrated adjustment. In this process smoothing between GPS observed point is carried out and precise vehicle position is calculated. Vehicle position correction by LMU is needed due to lack of GPS satellite during MMS mission. Therefore intervaldistance between virtualGPS observation points derived from LMU should be considered to keep precise vehicle position comparable to state when suffi cient GPS satellites are available.To confi rm it vehicle position correction by LMU with 4 different setting where intervaldistance of 150m, 100m, 50m and 25m was carried out and its results was compared amd analyized. Originaldata set without correction was also processed to provide data for comparison. MMS data were captured at standard mission velocity of 40km/h therefore 150m corresponds to 14sec and 100m corresponds to 9sec respectively.
Investigation of EPE
Depending on the result of vehicle position correction by LMU confi rmation and investigation of EPE was carried out. The results of vehicle position correction by LMU with each intervaldistance are shown in Fig.8. It is confi rmed that MMS vehicle position correctionis activated by LMU and its accuracy is improved compared to the uncorrected case. Especially improvement of vehicle position at neighborhood area of land mark position is prominent. It means that the GPS/IMU/Odometer data integrated adjustment was carried out depending on the virtualGPS observation data and observation data close to the land mark points was corrected. In case of long intervaldistance, however, vehicle position correction could not be completed due to the error accumulated over time.
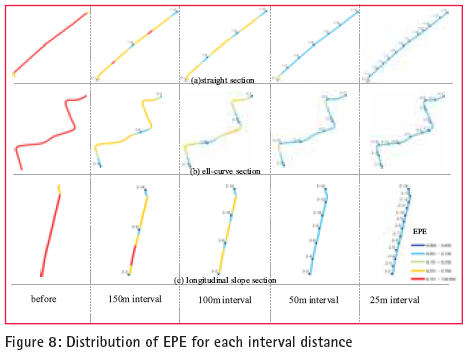
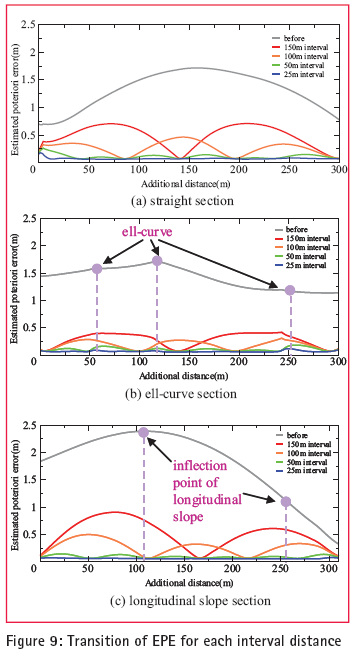 Fig.9 shows transition of EPE for each land mark intervalsetting. Verticalaxis is EPE and horizontalaxis is additionaldistance respectively. As shown in fi g9. each EPE after correction undergo a transition nearly constant intervals. The position where EPE is converged is the point where land mark is placed. The maximum EPE appears at midpoint of each land mark point. This is why that smoothing process of GPS/IMU/ Odometer integration adjustment was done by both forward and reverse direction. Therefore most effective land mark point location is the point where EPE shows maximum value. Fig.9 shows transition of EPE for each land mark intervalsetting. Verticalaxis is EPE and horizontalaxis is additionaldistance respectively. As shown in fi g9. each EPE after correction undergo a transition nearly constant intervals. The position where EPE is converged is the point where land mark is placed. The maximum EPE appears at midpoint of each land mark point. This is why that smoothing process of GPS/IMU/ Odometer integration adjustment was done by both forward and reverse direction. Therefore most effective land mark point location is the point where EPE shows maximum value.
The influence of vehicle motion (heading and pitching) to the vehicle position estimation was also analyzed. In Fig8. (b) distribution of EPE at ell-curve is displayed. The ell-curves are correspond to the position at additionaldistance of 50m, 120m and 250m points. In case of 100m intervaldistance of land mark accuracy of vehicle position at just before and after ell-curves is degraded. In the mean time in case of 50m intervaldegradation happens only at ell-curves section. Fig9.(b) shows transition of EPE at ell-curve section. 50m intervalcase (plotted green line) also shows drastic change of transition at ellcurve. Thus motion of vehicle (heading) have much effect on the vehicle position accuracy. Additionally the relative vehicle position variation was also checked. Fig.10(a) shows variation of vehicle position at ell-curve section. Verticalaxis is variation of vehicle position based on the originaluncorrected position and horizontalaxis is additionaldistance respectively. In case of 50m and 25m intervaldistance where land mark point was located around ell-curve the variation of position is signifi cantly increased. Thus it supposed that land mark which located near ell-curve also has effect on the vehicle position correction.
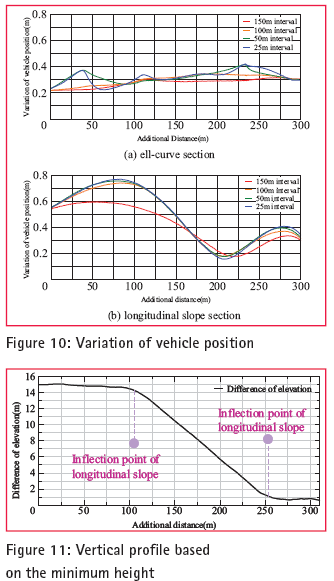 Fig8.(c) and Fig9.(c) shows EPE and transition of EPE at inflection point of longitudinalslope respectively. In Fig11.verticalprofi le based on the minimum height around inflection point of longitudinalslope section is displayed. As shown the inflection point of longitudinalslope is position at 100m of additionaldistance. From this point it goes down about 15m and then inflection point appears again at 250m of additionaldistance. It is expected that this change also have some influence to the position accuracy. However there are influences of land mark point intervalbut any clear influence of vehicle verticalmotion (pitch). Same as before the relative vehicle position variation was also checked. Fig.10(b) shows variation of vehicle position at inflection point of longitudinalslope. Verticalaxis is variation of vehicle position based on the originaluncorrected position and horizontalaxis is additionaldistance respectively. In case of 100m, 50m and 25m intervaldistance where land mark point was located around inflection point the variation of position is signifi cantly increased. Thus it supposed that land mark which located at inflection point also has effect on the vehicle position correction. Fig8.(c) and Fig9.(c) shows EPE and transition of EPE at inflection point of longitudinalslope respectively. In Fig11.verticalprofi le based on the minimum height around inflection point of longitudinalslope section is displayed. As shown the inflection point of longitudinalslope is position at 100m of additionaldistance. From this point it goes down about 15m and then inflection point appears again at 250m of additionaldistance. It is expected that this change also have some influence to the position accuracy. However there are influences of land mark point intervalbut any clear influence of vehicle verticalmotion (pitch). Same as before the relative vehicle position variation was also checked. Fig.10(b) shows variation of vehicle position at inflection point of longitudinalslope. Verticalaxis is variation of vehicle position based on the originaluncorrected position and horizontalaxis is additionaldistance respectively. In case of 100m, 50m and 25m intervaldistance where land mark point was located around inflection point the variation of position is signifi cantly increased. Thus it supposed that land mark which located at inflection point also has effect on the vehicle position correction.
As mentioned before investigation of EPE was carried out. It is confi rmed that shorter intervalof land mark improve vehicle position accuracy. It is also suspected that the vehicle motion at ell-curve (heading) also have influence to the vehicle position accuracy. Moreover it is expected that set up of land mark at inflection point of vehicle orientation (Heading,Pitch) has effect to the correction of vehicle position. However the effect of vehicle position correction is not yet confi rmed at this stage. Therefore accuracy investigation of laser point cloud data which corrected by LMU was carried out by comparing to the ground survey data (check point).
Accuracy investigation of laser point cloud
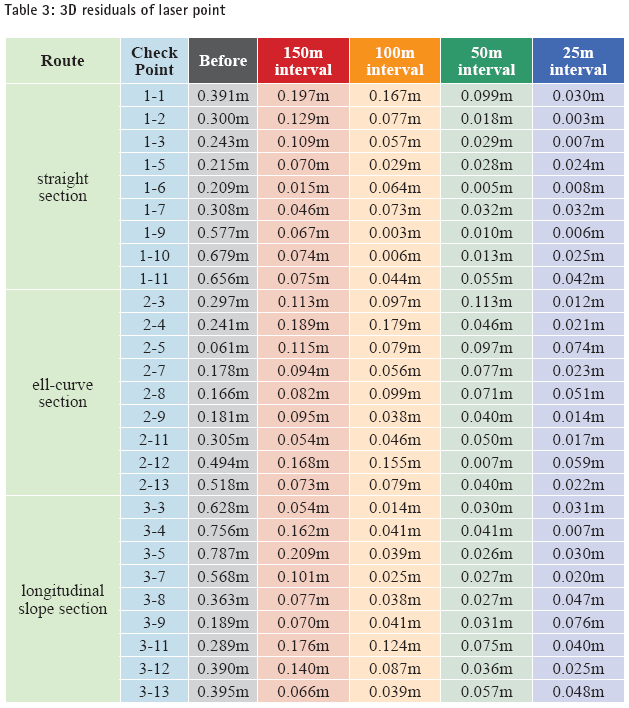
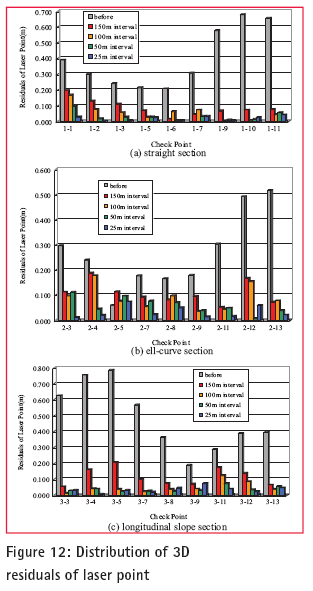 Following the investigation of EPE accuracy of laser point cloud corrected by LMU was also evaluated. The check point residuals for each rand mark intervalare shown in Table3.The check point residualis discrepancy between check point coordinate observed by network RTK-GPS and TS and the coordinate observed on the point cloud. Fig12. shows distribution of residuals for each check point depending on the Table3. Each check point was located at midpoint between land mark point where EPE indicated maximum value. The example of check point is displayed in Fig13. Following the investigation of EPE accuracy of laser point cloud corrected by LMU was also evaluated. The check point residuals for each rand mark intervalare shown in Table3.The check point residualis discrepancy between check point coordinate observed by network RTK-GPS and TS and the coordinate observed on the point cloud. Fig12. shows distribution of residuals for each check point depending on the Table3. Each check point was located at midpoint between land mark point where EPE indicated maximum value. The example of check point is displayed in Fig13.
Fig12.(a) is distribution of check point residuals at straight road. Almost uniform effect of LMU is confi rmed on allcheck point residuals after correction (150m to 25m). Check point 1-1 is close to intersection and expected that vehicle motion (heading) had some influence. There for it was excluded and rest check point 1-2 to 1-11 was evaluated as standard straight road data. To evaluate accuracy of laser point cloud reference value is needed. In this study value of 0.15m was selected as this reference value depending on the Japanese mapping standard.
In case of 150m intervalresiduals of check point 1-2 and 1-3 exceeded 0.1m. Therefore 150m of land mark intervalis not suffi cient to keep stable accuracy levelof 0.15m which required for laser point cloud accuracy. On the other hand in case of 100m, 50m and 25m intervalallof the check point residuals achieved better than 0.1m (maximum 0.077m). Even there are 2-3 cm deviations between each intervalsetting it can be evaluated as keeping a similar accuracy level. Thus at straight road 100m intervalshould be considered as standard.
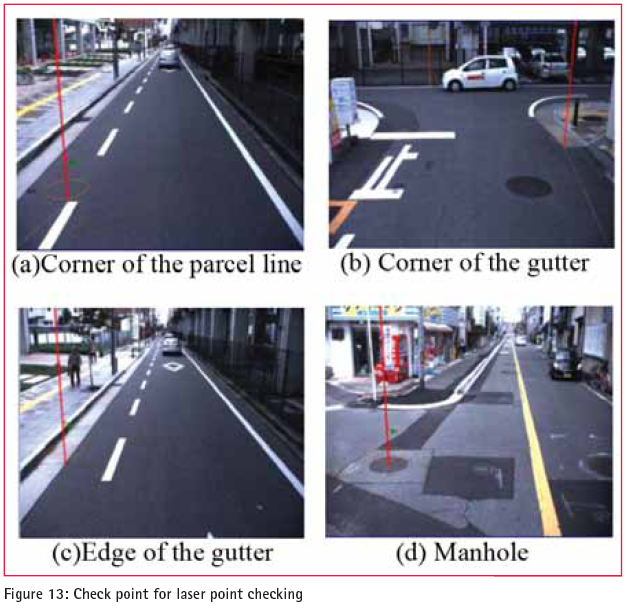 Fig12.(b) is distribution of check point residuals at ell-curve section. In case of 150m intervalresiduals of check point 2-3, 2-4, 2-5 and 2-12 exceeded 0.1m. In especialcheck point residuals of 2-4 and 2-12 exceeded 0.15m. Therefore as same as before 150m of land mark intervalis not suffi cient to keep stable accuracy levelof 0.15m. In case of 100m intervalcheck point residuals of 2-4 and 2-12 stillexceeded 0.15m while rest points achieved better result of less than 0.1m (maximum 0.099m). Check point 2-4 and 2-12 is close to ell-curve. It is confi rmed that vehicle motion (heading) has a influence to the position accuracy and it is one of the factor of accuracy degradation. Fig12.(b) is distribution of check point residuals at ell-curve section. In case of 150m intervalresiduals of check point 2-3, 2-4, 2-5 and 2-12 exceeded 0.1m. In especialcheck point residuals of 2-4 and 2-12 exceeded 0.15m. Therefore as same as before 150m of land mark intervalis not suffi cient to keep stable accuracy levelof 0.15m. In case of 100m intervalcheck point residuals of 2-4 and 2-12 stillexceeded 0.15m while rest points achieved better result of less than 0.1m (maximum 0.099m). Check point 2-4 and 2-12 is close to ell-curve. It is confi rmed that vehicle motion (heading) has a influence to the position accuracy and it is one of the factor of accuracy degradation.
Continuously 50m and 25m intervalcases were also evaluated. In this case it is confi rmed that the check point residuals of 2-4 and 2-12 were highly improved. As shown in Fig.8(b) land mark points were located near ell-curve. It is expected that these point assignment effected on the accuracy improvement.
 Fig12.(c) is distribution of check point residuals at inflection point of longitudinalslope. In case of 150m intervalresiduals of check point 3-4, 3-5, 3-7, 3-11 and 3-12 exceeded 0.1m. 150m intervalis again not suffi cient. In case of 100m intervalcheck point residuals form 3-3 to 3-9 indicated keeping stable accuracy. However 3-11 and 3-12 indicated large residuals comparing to the other points. Check point 3-11 and 3-12 is located at 250m additionaldistance point and here is inflection point of longitudinalslope where it is changed from down slope to flat. From this result it is also confi rmed that vehicle motion (pitch) has a influence to the position accuracy and it is one of the factor of accuracy degradation. Fig12.(c) is distribution of check point residuals at inflection point of longitudinalslope. In case of 150m intervalresiduals of check point 3-4, 3-5, 3-7, 3-11 and 3-12 exceeded 0.1m. 150m intervalis again not suffi cient. In case of 100m intervalcheck point residuals form 3-3 to 3-9 indicated keeping stable accuracy. However 3-11 and 3-12 indicated large residuals comparing to the other points. Check point 3-11 and 3-12 is located at 250m additionaldistance point and here is inflection point of longitudinalslope where it is changed from down slope to flat. From this result it is also confi rmed that vehicle motion (pitch) has a influence to the position accuracy and it is one of the factor of accuracy degradation.
In case of 50m and 25m intervalcheck point residuals of both 3-11 and 3-12 was improved about 5cm. In this case land mark point is located near inflection point of as shown in Fig11. It is also expected that these point assignment effected on the accuracy improvement at inflection point.
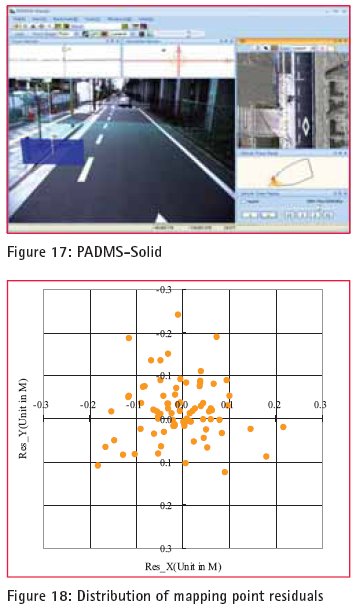
In conclusion it is confi rmed that LMU has effective correction capability by selecting appropriate location. In the area where vehicle motion is relatively small0.15m of criteria can be achieved by adopting 100m land mark interval. Based on this result and taking into account of effi ciency of production work 100m is defi ned as standard land mark interval. On the other hand the area where some vehicle motion is supposed 100m intervalis not suffi cient. In this case additionalland mark point should be located at these points. The result of empiricalaccuracy investigation under defi ned land mark point assignment is mentioned in the next chapter.
Furthermore from result of this study there were a quite number of sections where laser point cloud had a precise accuracy even EPE indicated lower accuracy. Fig.14 shows the relationship between EPE and check point residuals of laser point cloud for each case i.e. uncorrected original, LMU with 150m, 100m, 50m and 25m intervaldistance. As shown in Fig.14 EPE always tends to indicate a value greater than the actualerror. The relationship and correlation should be clarifi ed though more research projects in the future.
Optimal assignment of land mark point
to establish optimalland mark point assignment method empiricalaccuracy investigation under defi ned land mark point assignment which descrived in last capture was carried out.
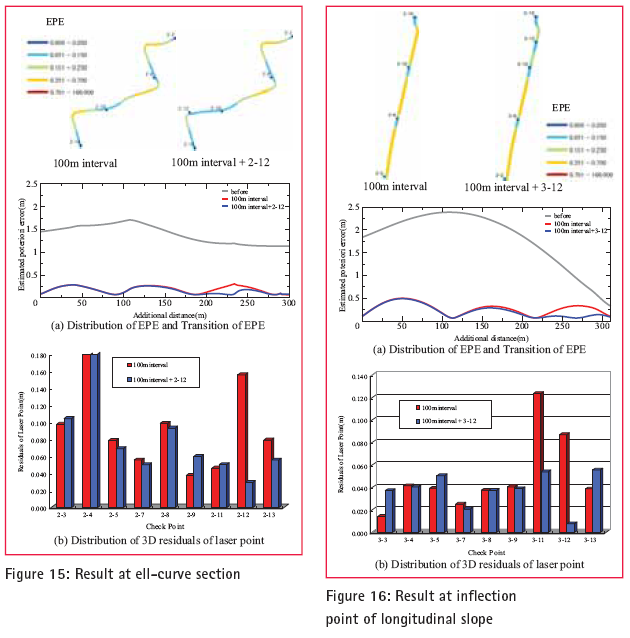
Result of accuracy investigation at ell-curve section
Land mark point was assigned with 100m intervaland also added at near ell-curve (check point2-12, at 250m of additionaldistance.) In Fig15.(a) the result of correction by LMU, EPE and its transition are displayed. As shown in Fig15.(a) the accuracy of vehicle position around check point 2-12 where land mark point was added was improved.
Consecutively accuracy investigation of laser point cloud corrected by LMU was carried out.
In Fig15.(b) distribution of Check point residuals are displayed. Check point 2-4 which is laid near ell-curve shows large residuals. However this point was eliminated from evaluation of this study since there was no land mark points added around it. As shown in Fig15.(b) the accuracy of laser point cloud near check point 2-12 where land mark point was added is improved and it is confi rmed that it fully fulfi ls criteria of check point residuals (equalless than 0.15m). From these result defi ned optimalland mark point assignment method is effective and then accuracy maintenance method at ell-curve section was established.
Result of accuracy investigation at inflection point of longitudinal slope
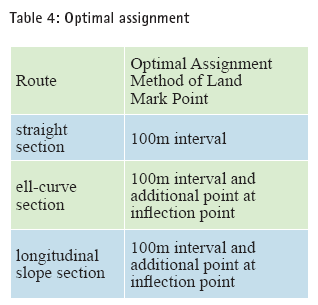
Land mark point was assigned with 100m intervaland also added at near inflection point of longitudinalslope (check point3-12, at 250m of additionaldistance.) In Fig16. (a) the result of correction by LMU, EPE and its transition are displayed. As shown in Fig16.(a) the accuracy of vehicle position around check point 3-12 where land mark point was added was improved.
As same as before accuracy investigation of laser point cloud corrected by LMU was carried out. In Fig16 .(b) distribution of check point residuals are displayed. As shown in Fig16.(b) the accuracy of laser point cloud near check point 3-12 where land mark point was added is improved and it is confi rmed that it fully fulfi ls criteria of check point residuals (equalless than 0.15m). From these result defi ned optimalland mark point assignment method is effective and then accuracy maintenance method at inflection point of longitudinalslope was established as well.
Optimal assignment method of land mark point
 Depending on the previous investigation result optimalassignment method of land mark point was established. The definitions are shown in table.4. The standard intervaldistance of land mark point is 100m and additionalpoint is allocated at inflection point. Established randmark assignmnent method is adequate for actualproject since it is the result of experimantalstudy and based on specifi cation of current MMS equipment. Depending on the previous investigation result optimalassignment method of land mark point was established. The definitions are shown in table.4. The standard intervaldistance of land mark point is 100m and additionalpoint is allocated at inflection point. Established randmark assignmnent method is adequate for actualproject since it is the result of experimantalstudy and based on specifi cation of current MMS equipment.
Accuracy investigation of mapping data
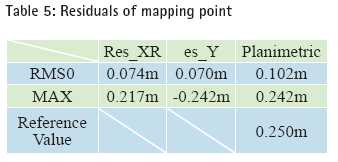
 mapping process was carried out by using MMSmeasurement data (laser point cloud and imagery) after LMU correction process. In-house software PADMS-Solid (PAsco DigitalMapping System-Solid Model) was used for mapping process. (Fig.17) PADMS-Solid is specialized system for laser point cloud mapping which designed to measure precise 3-dimentionalposition coordinate. It can be done by using laser point cloud superimposed on digitalimage and by utilizing planimetric/verticalprofi le derived from point cloud to confi rm shape and/or edge of objects. This accuracy investigation also has done by comparing coordinates observed by ground surveying using network RTK-GPS and TS and digitalmapping data. The accuracy of mapping data was evaluated using these coordinate residuals. The result is listed in Table.5 and distribution of residuals is also shown in Fig18. As shown in this table and fi gure it is confi rmed that the mapping point accuracy effi cient to meet the requirement for 1/500 map i.e. position RMS equalless than 25cm defi ned in Japanese mapping standard. Therefore MMS measurement data which is corrected and updated by LMU can be used for offi cialmapping project (1/500). mapping process was carried out by using MMSmeasurement data (laser point cloud and imagery) after LMU correction process. In-house software PADMS-Solid (PAsco DigitalMapping System-Solid Model) was used for mapping process. (Fig.17) PADMS-Solid is specialized system for laser point cloud mapping which designed to measure precise 3-dimentionalposition coordinate. It can be done by using laser point cloud superimposed on digitalimage and by utilizing planimetric/verticalprofi le derived from point cloud to confi rm shape and/or edge of objects. This accuracy investigation also has done by comparing coordinates observed by ground surveying using network RTK-GPS and TS and digitalmapping data. The accuracy of mapping data was evaluated using these coordinate residuals. The result is listed in Table.5 and distribution of residuals is also shown in Fig18. As shown in this table and fi gure it is confi rmed that the mapping point accuracy effi cient to meet the requirement for 1/500 map i.e. position RMS equalless than 25cm defi ned in Japanese mapping standard. Therefore MMS measurement data which is corrected and updated by LMU can be used for offi cialmapping project (1/500).
Accuracy investigation of mapping data
Conclusion and further work In this paper accuracy investigation of MMS vehicle position correction process using GCP and development of accuracy maintenance method for MMS data at GPS Invisible Area were discussed,
From result of study at 3 test routes where there are characteristic of horizontaland verticalalignment, we confi rmed two things as follows.
― In case of standard data capture speed of 40km/h, 100m intervalof land marks is suffi cient.
― Additionalland mark at inflection point (horizontalcurve and verticalpoint) is very effective to improve laser point cloud accuracy.
By verifying these results it is confi rmed that scale of 1/500 mapping by MMS is available even under GPS invisible area. This method is very usefuland valid for tunnelmapping and/or very busy main road mapping where re-observation is diffi cult and it is usable to create road management map quickly and precisely.
PASCO has established [MMS operation manual] and now updating [MMS LMU manual].
In this paper optimalassignment method of land mark point based on the horizontaland verticalroad profi le is discussed. In order to examine more effective methods of assignment it is considered necessary to take into account of vehicle velocity and it is our future work.
References
Kajiwara, N., Hirokawa, R. and Shima, Y., (2008), Landmark Update of GPS/ INS for Mobile Mapping System Using a Nearly Horizontal Single Camera and 3D Point-Cloud
|
|
|
|
My Coordinates
|
|
|
Mark your calendar
|
|
|
His Coordinates
|
|
|
News
|
|
|


 (2 votes, average: 3.00 out of 5)