Mapping


3D mapping from space?

Jul 2008 | Comments Off on 3D mapping from space?

Prof Dr Armin Gruen, Dr Kirsten Wolff

 
Neither the goals nor the procedures of 3D mapping are clearly defined yet
   

(a) Reference data for mapping
As reference data we used a digital version of the national topographic map 1:25,000 (Pixelmap) and the vectorized map (VECTOR 25) of this area, both products of the Swiss Federal Office of Topography. The planimetric accuracy is given as 3-8 m (corresponding to the map accuracy), which is by far worse than the geo-referencing and object measurement accuracy in IKONOS imagery. For quality control of manually measured contour lines we digitized the 10 m contour lines of the map.

img191

Figure 1. Comparison of the 10 m reference contour lines (black lines) and the manually drawn contour lines (dashed lines).Left: open area; middle: steep forest area with two small creeks; right: mixed area

(b) Manual drawing of contour lines
10 m contour lines were measured in an area of 4 x 5.5 sqkm by an experienced stereo operator of our group using Stereo Analyst, a 3D feature extraction tool of the ERDAS IMAGING system. For the visual quality evaluation we defined three sub-areas with special land use patterns (Figure 1: open area (left), forest (middle) and mixed flat area (right)). As expected, we got the best results for an open area with only
a few houses and less good results in the steeper woodland. The IKONOSderived contours resulted in a distinctive smoothing effect of the smaller geomorphological features. Therefore the problem is not so much the limited metric accuracy of the IKONOS-derived contours (the reference contours also had only an accuracy of 3-4 m), but the loss of geo-morphological detail. This of course is also caused by the fact that trees and bushes are restricting an accurate interpretation of the scene.

(c) Object extraction
We used the Stereo Analyst also for the extraction of all map features. The identification and mapping of buildings and roads/streets was done by our own stereo operator. But for the classification of roads/streets and for the identification of several individual features special knowledge of an experienced topographer is required. Here we received the support from our Federal Office of Topography (swisstopo) in form of one professional operator, familiar with the map legend of the Swiss topo-maps.

Both operators did not have any preinformation about the test area and did not use the reference data as preinformation for the measurements.

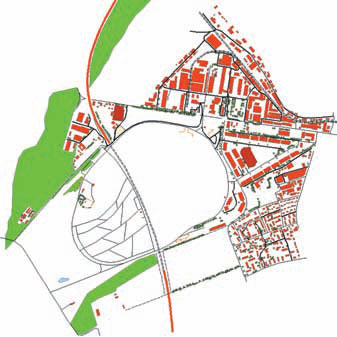
Figure 2 gives an overview of the measured buildings, roads/streets, railway, small airport, forests and single trees of the test area.

img201

Figure 2: Overview of the measured buildings, roads/streets, railway, small airport, forests and single trees of the test area Thun.

img22

Figure 3: Overview of a sub-area of the urban test area. Filled colour:
VECTO R 25, contours: IKONOS – extracted houses.

(c1) Identification and mapping of buildings
In the map buildings are presented by their footprints. Our operator measured the buildings in 3D, but for comparison only the 2D footprint of the roofs could be used. For a more detailed analysis we sub-divided the whole area in two kinds of sub-areas: industrial (160 buildings) and residential areas (165 buildings). For quality control we compared the extracted shapes of the houses with the VECTOR 25 data set visually. The main focus was on the identification of houses and their shape and less on the metric analysis of their correct position. The results are
classified into the following 6 categories:
Equal: shape and position of the houses considered as equal
Partial loss: parts of the houses are missing, same position
Total loss: the house could not be extracted
Forest: the house is covered by trees
Different position: same shape, different position
Improvement: the extracted shape or position is better.

img21

In case of differences in position of an individual building it can be assumed that the IKONOS mapping gives better planimetric accuracy than the given, cartographically modified (generalized and shifted) building data (see Figure 3).

Table 1 gives an overview of the results of the visual quality control of the extracted buildings. For a fully detailed analysis of the differences, an inspection trip into the field would be necessary. The results clearly show that the object identification from IKONOS imagery is not reliable enough.

The approximate mapping of the centerline of the roads was done by our operator without cartographic experience. In urban areas it was more difficult to measure the centerline than outside the town. Without an in-depth background in national mapping it was not possible for her to classify the streets in relation to the official classes of the national map. Some parts of smaller streets were covered by high buildings and trees. In such areas the interpreter tried to guess the run of the streets by analyzing the surrounding structure of the houses and trees. Altogether 163 street segments were analyzed. 11 (7%) of them could not be detected by our operator.

The classification of the streets and roads was investigated by two cartographic specialists. The main criterion for the classification was the width of the streets. We have 6 classes of roads: R1: >6m, R2: 4.2 – 6m, R3: 3 – 4.2m, R4: <4m, R5: dirt roads and R6: trails. Because of the limiting 1m resolution of the used images, it is very often not possible to distinguish between two neighboring classes. The images were taken in December, a period when dirty roads and trails are not used regularly and therefore it was difficult to identify them in several cases. The highway, railway rails and traffic circles could be easily identified and measured.

In future, additional features like pavements will be taken into account by swisstopo for a detailed classification. Such small details cannot be extracted from 1m resolution satellite images any more.


«Previous 1 2 3 4 5View All| Next»

Pages: 1 2 3 4 5

1 Star2 Stars3 Stars4 Stars5 Stars (1 votes, average: 1.00 out of 5)
Loading...