| Navigation | |
Choosing Suitable Map Projections for Worldwide Depiction of Electronic Charts in ECDIS
The paper provides a brief overview on the results of relevant research on the problem of the selection of suitable map projections for Electro nic Chart Display and Information Systems (ECDIS). It also proposes map projections for worldwide depiction of Electronic Charts on the ECDIS screen |
 |
|
International standards and industry practice on the employment of map projections for portrayal of electronic navigational charts in ecdis
The performance standards for Electronic Chart Display and Information Systems (ECDIS) published by the International Maritime Organization (IMO) as well as the international standards for Electronic Navigational Charts (ENCs) published by the International Hydrographic Organization (IHO) do not specify map projections for the display of Electronic Charts on the ECDIS screen. This lack of international standards for the employment of map projections in ENCs and ECDIS has left the choice of map projections to the manufacturer. As a result, some ECDIS systems employ map projections that bear some drawbacks and inadequacies such as:
– Poor visual perception and misinterpretations.
– Deficiency to depict Electronic Navigational Charts (ENCs) in the Arctic (ARHC 2011, ARHC 2012).
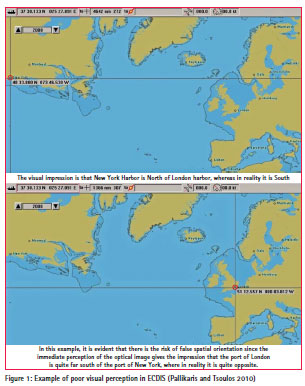
An example of poor visual perception is shown in figure 1 (Pallikaris and Tsoulos 2010). In this example we note the risk of false spatial orientation since:
– Placing the crosshair (cursor) in succession at the port of New York and the port of London, in order to obtain the geographical coordinates of these two locations, shows that the port of London is quite far north from the port of New York (more than 10º).
– Observing the position of the horizontal line of the cursor in either of these two points, give the wrong impression that the Port of London is quite far south of the port of New York. This wrong impression is enhanced by the normal practice in commercial ECDIS/ECS systems to not portray the graticule on the electronic charts covering extended geographical areas (i.e. in small scales).
The above-mentioned drawbacks and inadequacies of some ECDIS systems can be easily overcomeed by the selection of an alternative suitable map projection because in ECDIS it is not imperative to use specific map projections as it is in traditional navigation. This potentiality is true because in ECDIS the navigational computations are conducted analytically on the surface of the elliposoid and not on the surface of the mercator and Gnomonic projections as in traditional navigation methods based on the use of mercator and gnomonic paper charts.
In practice, due to the lack of official international standards for the employment of suitable map projections in ECDIS, different commercial systems provide different capabilities and choices as follows (Pallikaris 2012):
– Some systems use only one fixed projection and the user cannot change it. If only the Mercator projection is used, the system cannot depict ENCs in the Arctic (ArHC2-09A INF1 2011).
– On some other systems the user can select between a limited number of map projections.
– On other systems the choice of the projection is conducted auto matically by the system based on the location and the size of the area depicted on the screen. This automatic selection is normally done between the Mercator and the azimuthal stereographic projection. Neverthe less the automatic selection of map projections despite the inherent advantages, may in some cases cause poor visual perception and misinterpretations, as in the example of figure 1.
Research on the problem of the selection of suitable map projections for display of electronic navigational charts in ecdis
Despite the lack of official standards on the employment of map projections in ECDIS, it seems that some commercial systems have utilized the results of basic research for the effective depiction of Electronic Navigational Charts on the ECDIS screen. Unfortunately there is not written documentation for these cases, since these manufacturers have not publish, or announce the results of any relevant research. However, the results of relevant research have been detected implicitly through the evalua tion of available commercial systems. An example of such implicit evidence, about research conducted, or utilized by the industry, is the capability of some commercial systems to select auto ma ti cally the map projection between two alternatives. This selection is usually made between the Mercator and the azimuthal stereographic projection, in order to guarantee effective depiction of ENC in all geographical regions and overcome the inadequacy of the Mercator projection to depict polar regions. According to the results of a relevant study (Pallikaris and Tsoulos, 2010) the whatever advantages of these systems can be further improved for efficient and enhanced display of ENCs by the proper selection of map projections based on the adoption of specific selection criteria and rules. It has to be noted though that the proper choice of map projections for the depiction of ENCs on the ECDIS screen is vital for worldwide, or ocean region depiction, but for the depiction of smaller areas at medium and large scales, different map projections practically provide the same image on the ECDIS screen (Pallikaris 2012).
Concise analytical rules for the selection of map projections in ECDIS have been proposed by Pallikaris (2012). These rules suggest the choice between six different map projections according to the location and the size of the area depicted on the screen. It has to be stressed though that the choice of map projection is not necessarily unique and quite often more than one selection may fulfill equally the requirements. Moreover, in addition to the general rules and principles, it is possible to determine more specific rules and restrict the number of alternative choices for specific applications such as; the depiction of ENCs in the Arctic, the depiction over specific Ocean Regions and the worldwide depiction of ENCs. The results of a special research on the selection of suitable map projections for the depiction of ENCs in the Arctic have been recently published by Skopeliti and Tsoulos (2013). The current paper, presented in the European Navigational Conference “ENC GNSS 2014”, reports on the results of another research on the selection of suitable map projections for worldwide depiction of ENCs.
Criteria and methodology employed for the identification and evaluation of suitable map projections for worldwide depiction of encs in ecdis
Basic principles and requirements
In this study, the criteria that have been employed for the identification, evaluation and selection of suitable map projections for worldwide depiction of ENCs in ECDIS, are based on the general principles and requirements for the selection of map projections in ECDIS presented by Pallikaris (2012). These general principles have been modified and supplemented for the consideration of the particular requirements the worldwide depiction of ENCs in ECDIS, as follows.
i. The selected map projections should be capable to depict on the ECDIS screen the image of the whole surface of the earth extending from 90° south to 90° north and from -180° west to 180° east and not a part of it as it happens with the Mercator projection and the gnomonic projection that are used in traditional navigation.
ii. In ECDIS, map projections should be dynami cally parameterized and calcu lated so that the central point or central line of the projection coincides or approxi mates the center of the area displayed on the screen in order to con trol the amount and the distribution of angular and area distortion to limits ensuring that no serious visual deformation is generated.
iii. The employed in ECDIS map projections must have direct and inverse map transformation formulas allowing the convenient dynamic parameterization and calculation of the map projection, so that the central point or central line of the projection coincides or approxi mates the center of the area displayed on the screen.
iv. The shape of Great Circles (GCs) and Rhumb Lines (RLs) should depict their ba sic true characteristics on the spherical/ ellipsoi dal shape of the earth.
v. Map projections in ECDIS should facilitate the important for ma rine navigation “visual perception of the relative geo graphical location be tween any two points” (spatial orientation).
vi. When possible, the selected map projections should provide visual perception of the spherical/ ellipsoidal shape of the earth, provided that, this requirement is not seriously harming other basic but incompatible requirements.
Methodology for the evaluation of map projections for worldwide depiction of ENCs in ECDIS
The analytical methodology that has been used for the identification, evaluation and selection of map proje ctions for worldwide depiction of ENCs in ECDIS according to the above mentioned basic principles and requirements. Consists of a number of qualitative and quantitative criteria and rules, as they are briefly presented below.
Qualitative criteria for the initial selection of map projections
The initial stage of the conducted study was the determination of the set of map projections, which would be evaluated for the selection of the most suitable projections for worldwide depiction of ENCs on the ECDIS screen. The determination of this initial set of map projections has been based on the following generic qualitative criteria:
– “Ability to portray the whole globe in a familiar and pleasant view”
– “Visual perception of the relative geo graphical location between any two points”
– “Visual perception of the spherical/ ellipsoi dal shape of the Earth”
According to the criterion “Ability to portray the whole Globe in a familiar and pleasant view” and after an overview of the general characteristics of all types of map projections as they are presented in standard bibliographic sources (Snyder & Voxlan 1989, Pearson 1990, Maling 1992), Conic projections and Azimuthal projections have not been selected for further evaluation for the following reasons:
i) Conic projections cannot portray the whole globe.
ii) Azimuthal projections do not portray the whole globe in a familiar and pleasant view (Azimuthal stereographic and Azimuthal Equidistant), or cannot portray the whole globe (Gnomonic).
It has to be noted that the requirement for “Visual perception of the relative geographical location be tween any two points” is incompatible with the requirement for “Visual perception of the spherical-ellipsoidal shape of the Earth” (Palikaris 2012). For this reason the final selection of suitable map projections for the worldwide depiction of ENCs in the ECDIS screen has to be based eighther on on a balanced compromise between these two contradicting requirements, or, to be based on the user’s precedence over one these requirements.
The criterion “Ability to portray the whole globe in a familiar and pleasant view” is satisfied better by the following two pseudocylindrical projections “Robinson projection” and ”Loximuthal projection”. These projections fulfill the requirement for visual perception of the spherical/ellipsoidal shape of the Earth. The “Robinson projection” and ”Loximuthal projection” satisfy partially the requirement for “visual perception of the relative geo graphical location be tween any two points”, due to their property to portray parallels of latitude as straight parallels lines.
The map projections that fulfill better the requirement for “Visual perception of the relative geo graphical location be tween any two points” are the cylindrical projections due to the shape of their graticule (parallels and meridians are depicted as orthogonal straight lines). Cylindrical projections provide a familiar for the navigator view due to their strong visual resemblance to the Mercator projection. However, cylindrical projections do not fulfill the criterion “Visual perception of the spherical/ellipsoi dal shape of the Earth”.
Based on the above mentioned qualitative criteria and after a comparative study of the basic characteristics of the known map projections as they are presented in standard bibliographic sources (Snyder & Voxlan 1989, Bugayevskiy & Snyder 1989, Grafarend and Krumm 2006) the following map projections have been selected for further evaluation:
• Loximuthal Projection
• Robinson Projection
• Simple Cylindrical Equidistant Projection, with standard parallel at the equqtor, known as Plate Carrée
• Cylindrical Equidistant Projection with standard parallels at ±30°, ±30° and ±45.
• Cylindrical stereographic Projection, with standard parallel at the equqtor, known as Braun projection
• Cylindrical stereographic projection with standard parallels at ±30°, known as BASM (Bol’soy Sovetskiy Atlas Mira cylindric projection) Projection
• Cylindrical stereographic projection with standard parallels at ±45°, known as Gall Stereogra phic Projection
• Miller Cylindrical Projection
• Miller Cylindrical Modified Projection
Quantitative criteria for the evaluation of map projections
The second stage of the study was the conduction of analytical evaluation of the set of map projecti ons that has been initially determined according to the above mentioned qualitative criteria. The analytical evaluation of these map projections has been conducted by the employment of the following quanti tave criteria:
– “Amount and distribution of angle distortion”
– “Amount and distribution of area distortion”
– “Orthodromicity factor and Loxodromicity factor”
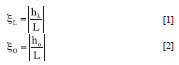
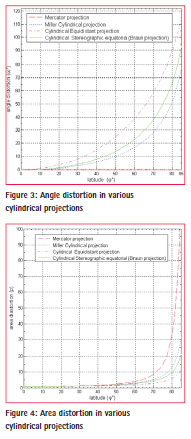
The criterion of the “Amount and distribution of angle distortion” and the criterion of the “Amount and distribution of area distortion” have been used in correlation to the tolerances for enhanced visual perception suggested by Bugayevskiy & Snyder (1989). According to these tolerances:
– Area distortion of values less than or equal to 8-10% is not usually detected by the human eye. – Area distortion of values 10% – 12% is slightly detected by the human eye.
– Angle distortion of values less than or equal to 8-10% is not usually detected by the human eye.
– Angle distortion of values 10% – 12% is slightly detected by the human eye.
For the display of ENCs over regional geographical areas the selection of proper map projections can guarantee that the values of angle distortion and area distortion are kept within tolerances ensuring that no serious visual distortion is generated. Nevertheless for worldwide or hemisphere depiction it is not possible to choose a map projection in which both angle distortion and area distortion will not be detectable. For this reason, in the conducted study the criteria of angle distortion and area distortion have been used in a flexible way aiming to a reasonable compromise between the contradicting requirements for the restriction of both angle and area distortion.
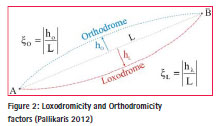
The criterion of the “Orthodromicity factor and Loxodromicity factor” is used for the assessment of the shape of long navigational paths on different map projections (Pallikaris 2012). The values of the loxodromicity factor ξL and the orthodromicity factor ξο are given by [1] and [2].
Where:
– L is the length of the straight line segment connecting the points of departure and destination on the projection (fig 2).
– hO and hL are the maximum distances of the line of the Great Circle (GC) or the Rhumb Line (RL) from the straight line segment connecting the points of departure and destination on the projection (fig 2).
In addition to the employment of the above-mentioned criteria for the conduction of numerical tests, the final evaluation of the initially selected map projections, has been also based on the results of the comparative study of the general characteristics of these map projections.
Results of the numerical tests and comparative study
The analytical evaluation of the map projections that have been initially selected according to the generic qualitative criteria has been conducted by the employment of the quantitative criteria as follows:
The criteria of the “Amount and distribution of angle distortion” and the criterion of the “Amount and distribution of area distortion” have been employed by:
– The calculation of the amount and the distribution of angular and area distortion for each proje ction and the construction of relevant graphs as those of figures 3 and 4. The calculation of angle distortion and area distortion has been carried out by the employment of the relevant formulas provided by Bugayevskiy & Snyder (1989).
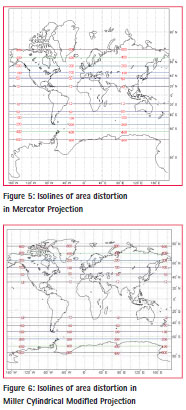
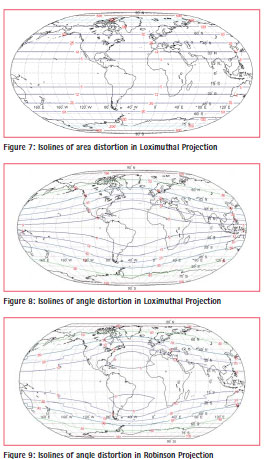
– The construction of maps showing isolines of area distortion for each projection as the maps of figures 5, 6 and 7.
– The construction of maps showing isolines of angle distortion for each projection as the maps of figures 8 and 9.
The construction of the maps depicting isolines of distortion and the maps depicting long navigational routes (Rhumb Lines and as Great Circles) has been done by the support of the S/W Matlab Mapping Toolbox after some necessary modifications of the original matlab code for some applications for the evaluation of the Miller Cylindrical Modified Projection.
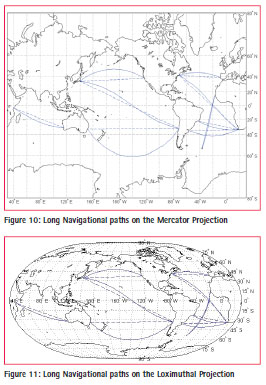
The criterion of the “Orthodromicity factor and Loxodromicity factor” has been employed for the evaluation of the shape of Loxodromes and Orthodromes by the construction of maps depicting long navigational routes as Rhumb Lines (RLs) and as Great Circles (GCs) like the maps of figures 10 and 11. The criterion “Orthodromicity factor and Loxodromicity factor” has to be employed as follows: Map projections, in which the orthodromicity factor ξO is smaller than the loxodro micity factor ξL, provide better visual perception of the true relation between the lengths of GCs and RLs. The explanation is that the condition hO>hL, implies that the line depicting the orthodrome is shorter than the line depicting the loxodrome between the same points of departure and arrival (figure 2).
In cylindrical projections, the loxodromes are practically depicted as straight lines, and consequently the values of the loxodromicity factor [1] for these projections are all equal to zero. Therefore, the assessment of the shape of long navigational paths in the evaluated cylindri cal projections has been restricted only to the shape of orthodromes and has been conducted by the calculation and compare son of the values of orthodromicity factors as follows. Cylindrical map projections with smaller values of the orthodromicity factor should be preferred against other cylindrical map projections, which have greater orthopdromicity factors (smaller values of the orthodromicity factor provide perception of shorter length of the portrayed navigational path – orthodrome).
The conducted comparative study and the analysis of the results of the numerical tests for the evaluation of the map projections that have been selected showed that:
Potential suitable map projection for worldwide depiction of ENCs on the ECDIS screen have to be looked for among the families of pseudo-cylindrical projections and cylindrical projections. For the worldwide depiction of ENCs on the ECDIS screen, the best choice between cylindrical map projections is the Miller Cylindrical Modified Projection with standard parallelς at 30°. This projection restricts considerably the great area distortion of the Mercator projection and retains angle distortion to acceptable limits (≤12°) over ex tended geographic coverage of latitudes on the zone [-63.5°, 63.5°].
For the depiction of ENCs over wide geographical areas, other cylindrical map projections are more suitable than the proposed for worldwide depiction modification of the Miller Cylindrical Modified Projection. For example the Mercator projection with standard parallels at latitude 15° S and 15° N, provides optimum distribution of area distortion (≤12%) over a broad and continuous latitude zone extending from 24° S to 24° N.
For the worldwide depiction of ENCs on the ECDIS screen, the best choice between pseodocylindrical map projections appears to be the Loximuthal Projection for the following reasons:
The Loximuthal projection has the special property that from the central point (the intersection of the central latitude with the central meridian), Rhumb Lines (loxodromes) are shown as straight lines, true to scale, and correct in azimuth from the center (Snyder and Voxland, 1989).
The Loximuthal projection has simple map transformation formulas, allowing a convenient incor poration of this projection into ECDIS as well as its dynamic parameterization by the selection of the central point of the projection in the center of the displayed area.
Unlike the Loximuthal projection, the Robinson projection does not provide the capability to be dynamically parameterized, because this projection is materialized by tabulated (x, y) coordinates instead of map projection formulas.
Despite the fact that the Loximuthal Projection in its standard equatorial form has slightly greater area and angle distortion than the Robison projection, it is possible to reduce distortion to values smaller than those of the Robinson projection by the selection of the central point of the Loximuthal projection on other than the equator standard parallel.
The amalgamation the above-mentioned findings, leads to the following general rules for the evaluation and selection of suitable map projection for worldwide depiction of ENCs on the ECDIS screen.
• If the interest of the user is focused on ocean areas that cover both the South and the North hemisphere, then the Miller Cylindrical Modified Projection with standard parallel at 30° should be used.
• If the interest of the user is focused on ocean areas over one hemisphere, then the Loximuthal Projection with its central point on the parallel of 15° (North or South) should be used.
Conclusions overview and proposals
The selection of a suitable map projection for worldwide and wide area depiction of ENCs on the ECDIS screen is vital. However for the display of ENCs over smaller areas, different map projections provide practically the same image on the ECDIS screen and therefore, in these cases the choice of a particular map projection is immaterial.
For the worldwide display of ENCs on the ECDIS screen the employment of the Mercator projection has two basic disadvantages: “inadequacy to depict ENCs at very high latitudes” and “big magnitudes of area distortion”.
In any case the selection of a suitable map projection for the depiction of ENCs on the ECDIS screen is not unique. Usually more than one projection fulfill satisfactory the requirements for effective display over a particular area (worldwide, regional, local).
The conducted study and the relevant numerical tests and comparisons showed that suitable map projections for worldwide depiction of ENCs on the ECDIS screen are the Loximuthal Projection and the Miller Cylindrical Modified Projection with standard parallel at 30°. For the display of areas over low and mid latitudes, the selection of other cylindrical projections provides slightly better results.
Conclusively, ECDIS can offer enhanced worldwide depiction of ENCs by the employment of the Miller Cylindrical Modified Projection with standard parallel at 30° and/or the Loximuthal pseudo- cylindrical projection. If the interest of the user is focused on ocean areas that cover both the South and the North hemisphere, then the Miller Cylindrical Modified Projection with standard parallel at 30° should be used. If the interest of the user is focused on ocean areas over one hemisphere, then the Loximuthal Projection with its central point on the parallel of 15° (North or South) should be used.
Acknowledgement
Another version of this paper has been presented in the European Navigation Conference ENS-GNSS 2014 (14-17 April 2014 Rotterdam) and published in the ENC-GNSS Proceedings online.
References
ARHC (2011). Arctic Regional Hydrographic Commission.. Proposal to address polar navigation issues related to ECDIS (ARHC2–08A). Proceedings of the 2nd ARHC Meeting, 27–29 September 2011, Copenhagen, Denmark. http://www.iho.int/mtg_docs/ rhc/ArHC/ArHC2/ArHC2Docs.htm. ARHC (2012). Arctic Regional Hydrographic Commission. Choosing a Suitable Projection for Navigation in the Arctic (ARHC3- 3.2.7). Proceedings of the 3rd ARHC Meeting, 9th to 11th October 2012 (Fram Center, Tromsø, Norway) http://www.iho.int/mtg_docs/rhc/ ArHC/ArHC3/ArHC3Docs.htm
Bugayevskiy, L. M. and J. P Snyder. Map Projections – A Reference Manual, Taylor & Francis, London 1998.
Grafarend, E. W. and F. Krumm (2006). Map projections – Cartographic Information Systems. Springer Verlag.
IHO (2010). Universal Hydrographic Data Model. S-100. IMO (2006). Revised Performance Standards for Electronic Chart Display and Information Systems (ECDIS). IMO Resolution MSC 82/24/Add.2/Annex 24 International Maritime Organization, London. Maling D. H. (1992). Coordinate systems and map projections, 2nd edition. Oxford: George Philip and Son, Pergamon Press.
Pallikaris A. (2012). Map Projections for Electronic Navigation and other Marine GIS Applications. International Hydrographic Review no 8, November 2012.
Pearson F. (1990). Map Projections: Theory and Applications. CRC Press. ISBN 0-8493-6888-X. Skopeliti A. & L.Tsoulos (2013) Choosing a Suitable Projection for Navigation in the Arctic, Marine Geodesy, Volume 36, Issue 2, 234-259.
Snyder, J. P. (1987). Map Projections: a working manual. US Geological Survey Professional Paper 1395, Washington, DC: U. S. Government Printing Office. Snyder, J. P. Voxland, P. M. (1989). An album of map projections. U.S. Geological Survey Professional Paper.


 (9 votes, average: 3.78 out of 5)


Leave your response!