| Navigation | |
Applications of Gabor wavelets in object recognition on side scan sonar images
The paper presents the results of Gabor fi lters’ responses calculation for the parts of the sonographs containing objects. The sonographs were taken in different time periods and with different settings. Proper analysis of fi lters’ responses leads to the recognition of corresponding objects |
 |
|
 |
|
Side scan sonars are widely used for objects detection in seabed clearance investigations. Multibeam data about bathymetry and backscatter may be not enough in terms of detecting small objects, possibly dangerous for navigation.
Side scan sonar provides monochromatic image of ensonified part of a seabed. Pixels’ brightness values are proportional to the strength of acoustic reflection from every object located within generated acoustic beam. Objects on the sea bottom may often be recognized not by their direct reflection but by their acoustic shadows, giving the information about their shapes and sizes (Waite, 2002; Blondel, 2009). Side scan sonar images (called sonographs) are usually examined by qualified operator. This process takes a lot of time and is affected by a possibility of human error. Earlier approach to object detection using image processing techniques is to set a threshold and generate a binary image where pixels are assigned to two possible categories: target or not-target (Rao et al., 2009). Further researches resulted in applying adaptive thresholding and statistical methods (Maussang et al., 2008). Earlier Bayesian approach has been proposed in (Calder et al., 1998). Successful tests’ results, presented in cited papers suggest that partial or full automatization of detection process is possible but some of developed techniques are not universal but optimised for a specified kind of objects. Potentially dangerous objects can be detected not only by analysing single sonograph but also by comparing the results of side scan survey with previously obtained images from the same area. Modern hydrographic software ensures the possibility of displaying sonographs conveniently for visual comparison but automatization of this process is still in a phase of development. Objects recognition and techniques associated with sonographs area comparing can be utilized in automatic sonograph analysis methods resulting in automatic changes detection.
The paper presents the description of test data acquisition system and survey process, details of computation technique based on Gabor wavelet analysis, resulting in the possibility of test object recognition and computations’ results as well as possible applications of obtained outcome.
Data acquisiton
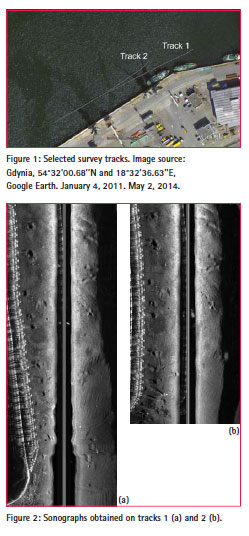
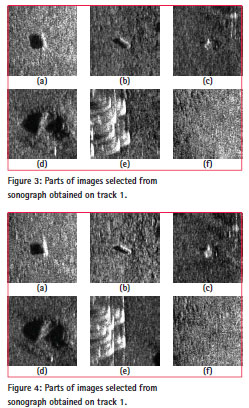
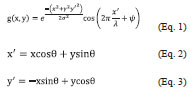
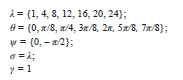
Sonar images used as examples in this paper were acquired in Gdynia Harbour, Poland. EdgeTech 272-TD Side Scan Sonar and CSI Wireless MiniMax DGPS, located on the survey boat were used as data acquisition system. Six different objects (wooden and metal boxes with dimensions from 10 cm to 1 m) were placed on the bottom of the Gdynia Harbour, approximately 5 to 15 m from the pier. Their positions were marked by buoys, which also ensured a possibility of objects recovering. Side scan sonar was towed parallel to the pier several times, approximately over the same survey line. Two chosen tracks are presented in Figure 1. Sonographs obtained on these two tracks are presented in Figure 2. Side scan sonar data was recorded in JSF files using EdgeTech Discover software. Digital images were created directly from JSF files using Matlab script, which was written based on JSF file format description. No additional processing software was used. Avoiding format conversions guarantee the best possible resolution, achievable from data stored in the file. Sonar images were not aligned at this stage of computation. They were visually examined and six pairs of matching parts of the images were chosen from these sonographs. They are presented in Figures 3 and 4. All chosen fragments are square-shaped and of the same size – 147 pixels wide. Images contain some of the objects detected by the sonar system on the seafloor (Fig. 3 and 4, a-d), elements of the pier construction (Fig. 3e and 4e) or just the visualization of approximately flat sandy seabed (Fig. 3f and 4f). Objects detected by the sonar system are located close to the centre points of the cropped images.
Gabor wavelet analysis of sonar images
Gabor wavelets in image processing
Gabor wavelets are used in image processing for example in face recognition techniques. The EGM (Elastic Graph Matching) technique is described in detail in (Lades et al., 1993; Tefas et al., 2010). The idea of image comparing by EGM technique is based on creating feature vectors for carefully chosen locations of the face image. The set of feature vectors for one location is called jet. Jets with their coordinates form the structure called EGM graph. The EGM graphs are computed for analysed images and those graphs are compared instead of comparing the whole images.
The feature vectors should be based on the image analysis technique, which provides the ability of (Tefas et al., 2010):
– describing the area in a particular neighbourhood around the graph node (location on the image),
– being robust for certain kinds of differences between images (pose variations and illumination changes),
– capturing only desired characteristics of described area (being discriminative),
– being easily computable.
Gabor wavelet transform is the most popular image analysis technique utilized in EGM. Results of the convolution of around-node areas of the images with the family of Gabor kernels give the subsequent values of jets’ elements (Tefas et al., 2010).
Gabor wavelets in sonograph’s analysis – jets’ computation
There is some sort of similarity between face images and sonographs in terms of comparing them. Both comparing techniques should be robust against displacements, geometrical transformations and changes of illumination (ensonification). The requirements for analysis techniques, listed above (section 3.1), match perfectly the assumption for sonar images comparison techniques. Gabor wavelet transform was tested for its usefulness in objects recognition on side scan sonar images leading to side scan images comparing.
2-dimensional Gabor kernels were computed using the equation proposed by Petkov in (Petkov et al., 1997).
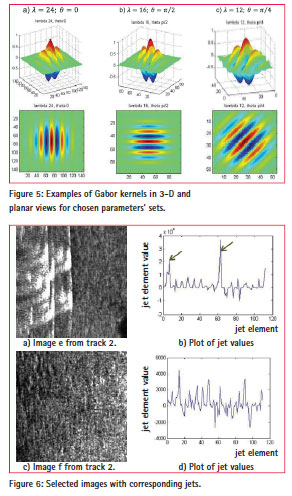
2D Gabor filter (Eg. 1) is a Gaussian function multiplied by a sinusoidal plane wave. λ is responsible for spatial frequency of the sinusoid in pixels. θ defines the orientation in radians. A set of 6 to 8 orientations and 3 to 5 spatial frequencies is usually used for building the information pyramid in case of face images, according to (Tefas et al., 2010). The following set of parameters was used for side scan sonar images:
These parameters were chosen after several computational experiments as giving the best discriminative properties of the results for side scan sonar objects.
The set of 7 frequencies and 8 orientations gives the family of 56 Gabor kernels. Three examples are shown in Figure 5.
A particular setup of frequency and orientation makes each kernel sensitive for a particular spatial frequency oriented in a particular direction.
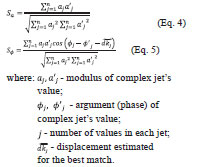
Convolutions of the images with the Gabor kernels located over the image central point gives the jet’s values. The jet is stored in a form of a vector of 112 elements (56 times 2 Ψ -values). The response on Gabor filter is in fact the complex number. Equation 1 allows computing them partially. First 56 elements (Ψ=0) correspond to real parts, and next 56 elements (Ψ = – x/2) to imaginary parts. Examples of jets (computed for images in Figures 6a and 6c) are plotted in Figures 6b and 6d.
The plot in Figure 6b contains noticeable peaks for jet’s elements number 7 and 63 (pointed by arrows in Figure 6b). These peaks refer to the kernel, computed for orientation θ = 0 rad. This is intuitively correct, because the image contains strong echo oriented vertically, parallel to the image side. Jet in Figure 6d contains a lot of peaks; none of them is strongly distinguished from the others. Image in Figure 6c (depiction of sandy seafloor) contains a lot of spatial frequencies in various directions, which can be compared to the noise.
Jets’ comparing
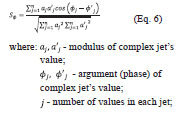
Real and imaginary values of jets a) Image e from track 2. c) Image f from track 2. jet element b) Plot of jet values jet element value jet element d) Plot of jet values jet element value Figure 6: Selected images with corresponding jets. are transformed to polar form and then compared using the following formulas for similarities functions (Wiskott et al., 1999):
The first formula – magnitude similarity (Eq. 4) – uses only magnitude information and ignores phase. The results are tolerant for small displacements of detected objects or small shifts of the Gabor kernel center. The second similarity function (Eq. 5) takes the advantage of phase information. According to Wiskott et al. ‘phase information is required to discriminate between patterns with similar magnitudes, should they occur, and secondly, since phase varies so quickly with location, it provides a means for accurate jet localization in an image’ (Wiskott et al., 1999, p. 358). The first advantage, mentioned by Wiskott, seems to be very important in sonographs’ analysis. Displacement is estimated in face recognition, where EGM graph containing jets is rearranged in order to find the best match for distorted faces’ images. Displacement information in computation is not used in sonographs’ analysis, because it cannot be assumed that one image contains the same objects like the other, just slightly displaced. The robustness for small displacements of both and is useful in image recognition and large jets differences will be necessary in the process of comparing the whole images. term is assumed to be 0, so is used in a form of the following formula:
Comparison results
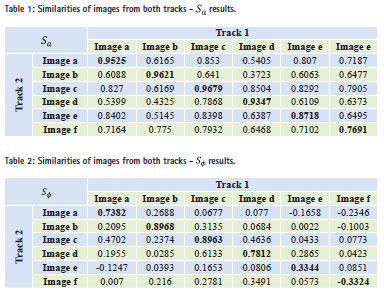
Similarities of jets for 6 images from track 1 with each one of 6 images from track 2 were computed using formulas from Equation 4 and 6. The results are presented in Tables 1 and 2. Values of and for matching images are shown in bold.
The average value for matching images is 0.9097 and for non-matching 0.6819. This allows setting a threshold of about 0.80 to distinguish between matching and non-matching objects detected on the images. threshold, found in the same way, is about 0.33. Image f is problematic in both and cases. It is shown in Figure 6d, that flat seabed image’s jet is similar to the noise, it has no distinguishable peaks, which makes it very difficult to compare the two images of flat sandy area. Threshold, set previously to 0.80 for and 0.33 for is not adequate for side scan sonar images presenting flat seabed. These cases are difficult not only for automatic systems but also for operators. It is often impossible to visually match two images presenting flat sea bottom, without examination of their neighbourhoods containing characteristic objects, pier elements or layout of distinguishable sediment types. The most important from the objects recognition point of view is that a background (or flat seabed) images are in most cases distinguishable from images containing objects, which can be useful in complex objects detection process based on image comparison.
Some authors express an opinion that Gabor kernels work similarly to the human way of visual perception (Lee, 1996; Jian et al., 2009). It is intuitively true for presented sonographs. We are able to recognize the objects on sonographs, analysing their relative or absolute sizes, shapes or spatial geometry of objects’ groups, but we may have a serious problem with recognizing the areas of flat seafloor without analysing the characteristic features in their neighbourhood.
Increasing the number of kernels (obtained by increasing the number of different �� and �� values used for computation) does not enhance the ease of thresholding between matching and non-matching images. Higher number of kernels also means the higher computational effort necessary to obtain jets. It was checked by test computations that the set of values described earlier is optimal in terms of obtained threshold and computationally efficiency.
Possible applications
Gabor wavelets analysis can be used for different purposes in sonar images processing and comparing. Main application – object recognition – can act as a part of complex processes, like sonograps’ alignment and multifaceted images comparing.
Objects recognition
Earlier approach for recognizing objects was based on thresholding, converting to binary images and calculating properties for certain binary areas. Every gain adjustment changes the general brightness level and affects required threshold level. If a threshold value is changed, binary area will be affected. Threshold for objects detection is usually set manually or other technique, optimised for a specific kind of object, is applied (Rao et al., 2009). Algorithms for automatic threshold settings in general image processing (based for example on histogram analysis) are designed mostly for high contrast digital images. This is often problematic in case of usually noisy, relatively low resolution sonographs, where differences between objects, shadows and background are small.
Object recognition based on Gabor wavelets analysis is different. Computed jets are robust for changes in gain settings, small displacement of objects or small changes in ensonification direction. Threshold for similarity function values, set once, can be used for different images, because is not affected by the brightness level of the whole images, only by spatial frequencies contained in the images. Simple procedure can be used to find the answer for the question: does the object detected on one image match the object detected on different sonograph of the same area?
1. Extract the parts of both images containing investigated objects.
2. Calculate the jets for both extracted parts.
3. Find similarity functions values. Different distance metrics (for example Euclidean or Mahalanobis) or normalized correlation of jets (Tefas et al., 2010) can be used instead or apart from similarities function presented in this paper.
4. Check the values in terms of threshold exceeding.
Sonographs’ alignment
Object recognition can be considered not as a stand-alone process but as a part of complex image comparison procedure. It usually starts with image enhancement followed by very important and difficult from the automatization point of view step: image alignment.
Image alignment is similar to mosaicing. In fact, mosaicing is nothing else like aligning the overlapping parts of adjacent sonographs. The main purpose of mosaicing is to cover a large area with adjacent stripes of sonographs with only side parts overlapping. Aligning images for comparison purposes requires aligning two or more images of the same scene, as much overlap as possible is required. Towfish should be towed over the same survey line.
It is not possible to achieve exactly the same track of towing, because of the characteristics of towed side scan sonar survey system. The towfish is towed on the elastic tow cable, so every speed or course change affects the movements of the transducer. Even if operator is trying to avoid rapid changes of towing parameters, the images are never perfectly aligned. There are two possible approaches to the problem of sonographs alignment for comparison purposes or standard mosaicing:
– based on geographical content;
– based on reference points.
Alignment based on geographical content is used in most of hydrographic software for sonographs mosaicing. GPS positions are recorded by data acquisition system and then used to determine the spatial location of sonar image on a map in certain scale. Waterfall image is also transformed in a way considering the course changes. Details can be found in for example in (Paflczyfiski, 2009). The main source of problem with this kind of alignment is the location of GPS antenna on the survey vessel, not over the towed equipment. Widely used layback technique (Blondel, 2009) is usually accurate enough for mosaic presenting the general depiction of the sea bottom, but often not precise enough to automatically compare details on two pictures. GPS position data can be supported by data from underwater navigation system, but this requires additional dedicated equipment.
The second alignment technique is based on choosing several reference points on two images. Images are then transformed to superimpose the reference points. GPS data can be unused or used initially for general alignment or survey data selection. Aligned images are not distortion free, but objects and areas on one image should correspond with the same objects and areas on the other. Reference points in most cases are chosen manually. Object recognition techniques based on Gabor filtering may be used for automatization of reference points’ choosing. Preliminary computational tests shows that alignment by automatically chosen reference points is possible for sonar images with test objects located on approximately flat sandy seabed.
Complex image comparison algorithm
Images alignment and objects recognition can be combined in complex image comparison algorithm as follows:
1. Images enhancement – optional processes like beam pattern correction, various gain corrections and despecle filters offered currently by most hydrographic software;
2. Images alignment – techniques based on positioning system data and automatic reference points choosing can be combined;
3. Jets computation for areas centred on chosen, regularly arranged points;
4. Changes detection based on similarity functions.
Preliminary tests conducted for this algorithm checking shows, that Gabor filters and jets technique is capable of detecting small changes on the sea bottom, like the presence of new object, not recorded on the sonograph obtained before in the same area.
Conclusion
Gabor wavelet analysis, used in image processing for example for face recognition, after some modification, can be successfully used for objects recognition on side scan sonar images. Object recognition, in analysed cases, is not a stand-alone process, but can be a part of complex techniques, which can improve the mosaicing routines and images alignment methods. These techniques, together with additional processes including images enhancement and jets computation for regularly arranged points, can be used as a complex image comparison algorithm capable of detecting small changes on the analysed images.
Acknowledgment
The paper was presented at ENCGNSS 2014 (15 – 17 April, Rotterdam, Netherlands) and published in the ENC-GNSS Proceedings online.
References
Blondel P. (2009). The handbook of sidescan sonar, Praxis Publishing, UK.
Calder B.R., L.M. Linnett and D.R. Carmichael (1998). Bayesian approacht object detection in sidescan sonar, IEE proceedings -vision, image and signal processing 145 no. 3, pp. 221–228.
Jian M., H. Guo, and L. Liu (2009). Texture Image Classification Using Visual Perceptual Texture Features and Gabor Wavelet Features, Journal of Computers, Vol. 4, No 8, pp. 763-770. Lades M., J.C. Vorbruggen, J. Buhmann, J. Lange, C. von der Malsburg, R.P. Wurtz and W. Konen (1993). Distortion invariant object recognition in the dynamic link architecture. IEEE Trans. on Computers, 42(3), pp. 300-311.
Lee T.S. (1996). Image Representation Using 2D Gabor Wavelets, IEEE Trans. Pattern Analysis and Machine Intelligence, 18, pp. 959–971.
Maussang F., M. Rombaut, J. Chanussot A. Htet, and M. Amate (2008). Fusion of local statistical parameters for buried underwater mine detection in sonar imaging, EURASIP Journal on Advances in Signal Processing No. 876092.
Paflczyfiski M. (2009). Automation of sonar map creating based on sidescan sonar images (in Polish), Roczniki Geomatyki VII, 5(35)
Petkov N. and P. Kruizinga (1997). Computational models of visual neurons specialised in the detection of periodic and aperiodic oriented visual stimuli: Bar and grating cells. Biological Cybernetics 76, pp. 83–96.
Rao C., K. Mukherjee, S. Gupta, A. Ray and S. Phoha (2009). Underwater mine detection using symbolic pattern analysis of sidescan sonar images, 2009
American control conference, St. Louis, MO, USA, June 10-12, 2009
Tefas A. and I. Pitas (2010). Face Verification based on Elastic Graph Matching. Biometrics. Theory, Methods and Appications, ed. Boulgouris N., Plataniotis K. and Micheli-Tzanakou E., IEEE Press, Piscataway, NJ.
Waite A.D. (2002). Sonar for practising Enigineers. John Wiley & Sons, Ltd., Chichester.
Wiskott L., J. Fellous, N. Kruger and C. Malsburg (1999). Face Recognition by Elastic Bunch Graph Matching. Intelligent Biometric Techniques in Fingerprint and Face Recognition, ed. Jain L.C. et al., CRC Press, pp. 355-396.


 (2 votes, average: 3.00 out of 5)


Leave your response!