| Applications | |
Spatially Smart Wine
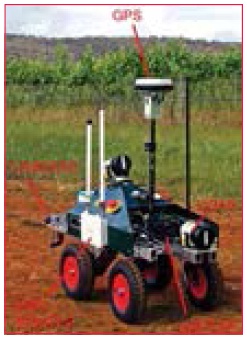
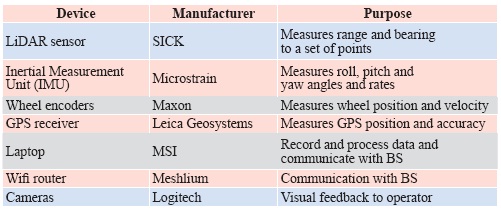
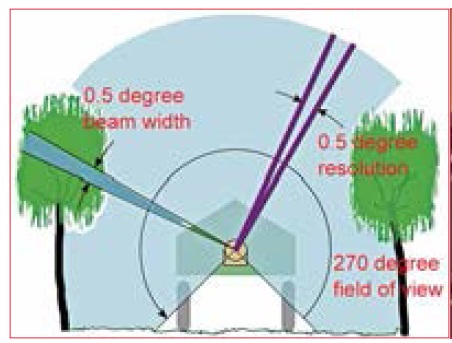
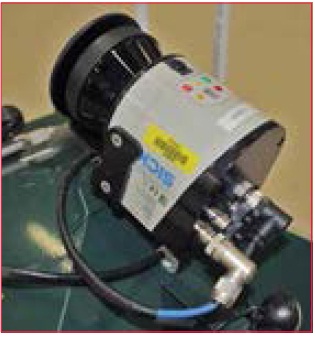
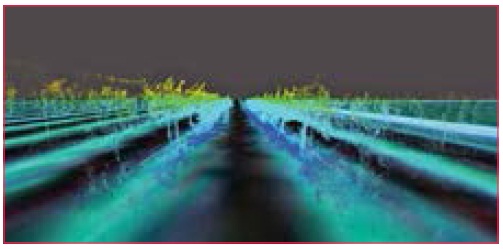
Unmanned Ground Vehicle (UGV): Testing and applicationsHere we present an Unmanned Ground Vehicle (UGV) which contains technologies for automated yield estimation which are readily applicable to many existing agricultural machines. The UGV was developed in the School of Mechanical and Manufacturing Engineering at the University of New South Wales under the direction of Associate Professor Jayantha Katupitiya and Dr Jose Guivant. As shown in Figure 4, it is a four wheeled vehicle equipped with sensors and actuators for teleoperation and full autonomous control. Weighing 50kg, it is a comprised of Commercial-Off-the-Shelf (COTS) sensors, a custom-made mechanical base and a low-cost onboard laptop with a wireless connection to a remote Base Station (BS). Of particular note is ready retrofi tting capacity of the COTS sensors to existing farm machinery. System overviewThe equipment contained in the vehicle is shown in Table 4. Of this the relevant items are the rear 2D LiDAR sensor, the IMU, the CORS-corrected GPS receiver and the wheel encoders. Together with the onboard computer, these items allow accurate georeferenced point clouds to be generated which are accurate to 8cm. The output is not limited to point clouds, as any other appropriately sized sensors can be integrated to provide precise positioning of the sensed data, either in real-time or by post-processing. Measurement estimation and accuracyThe following paragraphs show how the pose of the robot is accurately estimated and then how this pose is fused with the laser data to obtain 3D point clouds. Given the uncertainty of the robot pose, we also derive expressions for the resultant uncertainty of each point in the point cloud. Furthermore, the average case accuracy is compared with that obtained from aerial LiDAR and the advantages and disadvantages of both methods of data gathering are discussed from the perspective of PV. As discussed, the CORS-linked GPS sensor mounted o n the UGV provides both the position and position uncertainty of the vehicle in ECEF coordinates. In this case the MGA55 frame was used to combine all the sensor data for display in one visualisation package. The GPS position was provided at 1Hz and given the high frequency dynamics of the robot’s motion, higher frequency position estimation was necessary. Hence an inertial measurement unit (IMU), containing accelerometers and gyroscopes, was mounted on the vehicle providing measurements at 200Hz. The output of this IMU was fused with the wheel velocities as described in (Whitty et al., 2010) to estimate the short term pose of the vehicle between GPS measurements. The IMU also provided pitch and roll angles, which were used in combination with the known physical offset of the GPS receiver to transform the GPS provided position to the coordinate system of the robot. Given the time of each GPS measurement (synchronised with the IMU readings), the set of IMU derived poses between each pair of consecutive GPS measurements was extracted. Assuming the heading of the robot had been calculated from the IMU readings, the IMU derived poses were projected both forwards and backwards relatively from each GPS point. The position of the robot was then linearly interpolated between each pair of these poses, giving an accurate and smooth set of pose estimates at a rate of 200Hz. Since the GPS measurements were specifi ed in MGA55 coordinates and the pose estimates calculated from these, the pose estimates were therefore also found in MGA55 coordinates. The primary sensor used for mapping unknown environments was the SICK LMS151 2D laser rangefi nder. Figure 6 pictures one of these lasers, which provided range readings up to a maximum of 50m with a 1σ statistical error of 1.2cm. Figure 5 shows the Field of View (FoV) as 270° with the 541 readings in each scan spaced at 0.5° intervals and recorded at a rate of 50Hz, giving about 27 000 points per second. Its position on the rear of the robot was selected to give the best coverage of the vines on both sides as the robot moves along a row. To accurately calculate the position of each scanned point, we needed to accurately determine the position and orientation of the laser at the time the range measurement was taken. All of the IMU data and laser measurements were accurately time stamped using Windows High Performance Counter so the exact pose could be interpolated for the known scan time. Given the known offset of the laser on the vehicle, simple geometrical transformations were then applied to project the points from range measurements into space in MGA55 coordinates. Complete details are available in Whitty et al., (2010) which was based on similar work in Katz et al. (2005) and Guivant (2008). This calculation was done in real-time, enabling the projected points – collectively termed a point cloud – to be displayed to the operator as the UGV moved. Information representation to operatorThe display of the point cloud was done using a custom built visualisation program which was also adapted to read in a LiDAR point cloud and georeferenced aerial imagery obtained from a fl ight over the vineyard. Since all these data sources were provided in MGA55 coordinates, it was a simple matter to overlay them to gain an estimate of the accuracy of the laser measurements. Figure 7 shows the terrestrial point cloud overlaid on the image data where the correspondence is clearly visible. Given that the pointcloud is obtained in 3D, this provides the operator with a full picture of the vineyard which can be viewed from any angle. Fusion of sensor data and calculation of accuracyAlthough the above point cloud generation process has been described in a deterministic manner, in practice measurement of many of the robot parameters is usually not precise. By performing experiments, we were able to characterise these uncertainties individually and then combine them to estimate the uncertainty in position of every point we measured. In the fi eld of robotics, these uncertainties are typically characterised as a covariance matrix based on the standard deviations of each quantity, assuming that they are normally distributed. The covariance matrix giving the uncertainty of the UGV’s pose in MGA55 coordinates is a 6×6 matrix. The UGV’s pose itself is given by a vector which concatenates the 3D position and the orientation given in Euler angles. Since the GPS receiver was offset from the origin of the UGV’s coordinate system, the GPS provided position was transformed to the UGV’s coordinate system by rigid body transformation. However, the uncertainty of the angular elements of the pose meant that the GPS uncertainty must not only be shifted but be rotated and skewed to refl ect this additional uncertainty. An analogy is that of drawing a straight line of fi xed length with a ruler. If you don’t know exactly where to start, then you have at least the same uncertainty in the endpoint of the line. But if you also aren’t sure about the angle of the line, the uncertainty of the endpoint is increased. A similar transformation of the UGV uncertainty to the position of the laser scanner on the rear of the UGV provided the uncertainty of the laser scanner’s position. Then for every laser beam projected from the laser scanner itself, a further transformation gave the covariance of the projected point due to the angular uncertainty of the UGV’s pose. Additionally, we needed to take into account uncertainty in the measurement angle and range of individual laser beams. This followed a similar pattern and the uncertainty of the beam was calculated based on a standard deviation of 0.5 degrees in both directions due to spreading of the beam. Once the uncertainty in the beam, which was calculated relative to the individual beam, was found, it was rotated fi rst to the laser coordinate frame and then to the world coordinate frame using the corresponding rotation matrices. Finally, the uncertainty of the laser position was added to give the uncertainty of the scanned point. Comparison of aerial and terrestrial LiDARAn experiment was conducted at the location detailed in Section 1.2. The UGV was driven between the rows of vines to measure them in 3D at a speed of about 1m/s. The average uncertainty of all the points was calculated and found to be 8cm in 3D. Table 5 shows how this compares with about 1.2m for the aerial LiDAR but has the disadvantage of a much slower area coverage rate. The major advantages however are the increased density of points (~3000 / m3), ability to scan the underside of the vines and greatly improved resolution. Also, the terrestrial LiDAR can be retrofi tted to many existing agricultural vehicles and used on a very wide range of crops. Limited vertical accuracy – a drawback of GPS – is a major restriction but this can be improved by calibrating the system at a set point with known altitude. For PV, the terrestrial LiDAR system clearly offers a comprehensive package for precisely locating items of interest. Further developments in processing the point clouds will lead to estimation of yield throughout a block and thereby facilitating implementation of performance adjusting measures to standardise the yield and achieve higher returns. For example, a mulch delivery machine could have its outfl ow rate adjusted according to its GPS position, allowing the driver to concentrate on driving instead of controlling the mulch delivery rate. This not only reduces the amount of excess mulch used but reduces the operator’s workload, with less likelihood of error such as collision with the vines due to fatigue. ConclusionIn this paper we have evaluated several state-of-the-art geospatial technologies for precision viticulture including multilayered information systems, GNSS receivers, Continuously Operating Reference Stations (CORS) and related hardware. These technologies were demonstrated to support sustainable farming practices including organic and biodynamic principles but require further work before their use can be widely adopted. Limitations of the current systems were identifi ed in easeof- use and more particularly in the lack of a unifi ed data management system which combines fi eld and offi ce use. While individual technologies such as GIS, GNSS and handheld computers exist, their integration with existing geospatial information requires the expertise of geospatial professionals, and closer collaboration with end users. In addition we demonstrated the application of an unmanned ground vehicle which produced centimetrelevel feature position estimation through a combination of terrestrial LiDAR mapping and GNSS localisation. We compared the accuracy of this mapping approach with aerial LiDAR imagery of the vineyard and showed that apart from coverage rate the terrestrial approach was more suited in precision viticulture applications. Future work will focus in integrating this approach with precision viticulture machinery for estimating yield and controlling yield-dependent variables such as variable mulching, irrigation, spraying and harvesting. The end product? Spatially smart wine. AcknowledgementsThe authors wish to acknowledge the following bodies and individuals who provided equipment and support: Land and Property Management Authority (in particular Glenn Jones), CR Kennedy (in particular Nicole Fourez), ESRI Australia and the University of New South Wales. Particular thanks go to the vineyard owner and manager, Justin Jarrett and family. ReferencesArnó, J., Martínez-Casasnovas, J., Ribes-Dasi, M. & Rosell, J. (2009) Review. Precision Viticulture. Research topics, challenges and opportunities in site-specifi c vineyard management. Spanish Journal of Agricultural Research, 7, 779-790.
|





 (58 votes, average: 1.02 out of 5)


Leave your response!