| GNSS | |
Performance evaluation of the effect of QZS on precise positioning
An overall real performance evaluation was conducted base upon stand-alone positioning and RTK positioning in several environments |
 |
|
||||
 |
|
||||
 |
|
||||
 |
|
||||
 |
|
||||
A QZS (quasi-zenith satellite), which was anticipated to be the original Japanese positioning satellite, was launched in September, 2010. As an augmentation system of GNSS, two MTSATs had already been put into orbit and their main purpose is to broadcast the correction data for wide-area DGPS. This has actually improved the accuracy of wide area DGPS as a result of reception of the correction data from MSAS (MTSAT Satellite-based Augmentation System). The QZS also enhances the ranging function and it already has signal characteristics for the GNSS that are expected in the near future.
The main feature of QZS is that it stays at a high elevation-angle over Japan for a long time, a feature that was expected to have a positive effect upon high-accuracy positioning. This paper reports several experiments that were conducted to verify the expected effect, particularly in urban areas, because a high-elevation satellite can improve the total performance in terms of the number of visible satellites. In section 2, we describe an outline of the QZS, and we also present real data from QZS, including elevation, azimuth, and stand-alone positioning. The general performance of RTK in urban areas and the algorithm used in this paper are then discussed in Section 3. The steps taken to improve RTK performance are also described briefly. Finally, in Section 4, several test results based upon the use of GPS+QZS in Tokyo are verified.
Overview of QZS
Configurations of QZS
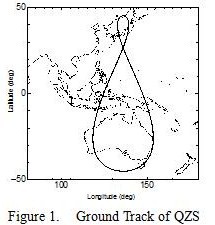
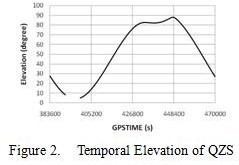
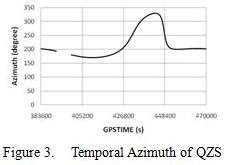
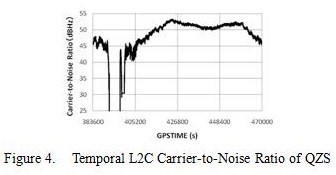
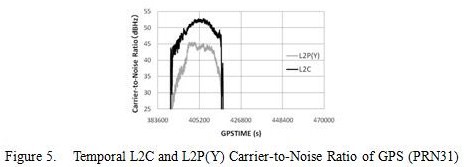
Typical signal parameters of QZS are presented in Table 1. The ground track of QZS’s orbit is shown in Figure 1. QZS also transmits an L1C signal for future GNSS. The signals used in our algorithm are L1-C/A and L2C, as shown in Table 1. It is known that the signal strength of L2C is greater than the signal strength of L2P(Y) transmitted by GPS. The number of GPSs transmitting L2C was 8 in April 2011. The received signal power of GPS L2P(Y) is approximately -161.5 dBW (in case of Block-IIR-M/IIF) [3]. For the sake of consistency, in this analysis, an L2P(Y) signal is used for all GPS satellites. It is strongly expected that the L2C signal will be able to be used in the near future because the signal strength in dense urban areas decreases especially in the L2 band. Figure 1 shows the ground track of the QZS orbit. As can be seen in the figure, QZS spends a long time over Japan. Figure 2 shows the temporal elevation-angles of QZS in Tokyo for 24 h. Figure 3 shows the temporal azimuth angles of QZS in Tokyo for 24 h. These data were obtained on the rooftop of our laboratory in Tokyo from January 13- to 14, 2011. The receiver used in this test was a JAVAD DELTA, a receiver that was custom-designed to process QZS signals. The signal strength of L2C of the QZS is shown in Figure 4. The signal strength of L2C and L2P(Y) of GPS PRN31 are also shown in Figure 5.

A period in which the signal was unstable was omitted from Figures 2, 3, and 4. During this period, the elevation angle was less than 10°. As can be seen in Figure 2, QZS stays for about 7 h over 80° and about 9 h over 70° (The scale interval of the horizontal axis is 6 h). The carrier-to-noise ratio of L2C is sustained at least 40dBHz as long as the elevation angle is greater than 10°. The dark line (upper line) in Figure 5 shows the carrier-to-noise ratio of L2C for GPS PRN31, and the light line (lower line) shows the carrier-to-noise ratio of L2P(Y) for GPS PRN31. It can be seen that the signal strength of L2P(Y) is much lower than that of L2C.
Stand-alone positioning of GPS+QZS
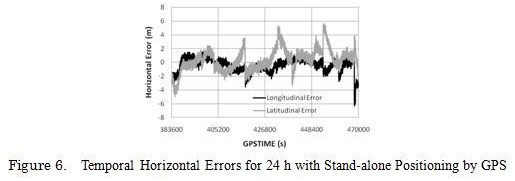
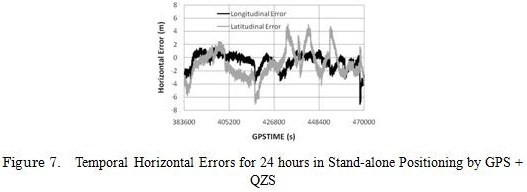
The stand-alone positioning horizontal results of GPS and GPS + QZS are shown in Figure 6 and Figure 7. In these figures, the light line indicates the errors in latitude and the dark line indicates the errors in longitude. Although there is not a big difference between the results for GPS and those for GPS + QZS, the results for GPS + QZS fluctuate a little. In fact, the standard deviation of the horizontal errors for GPS was 1.90 m and that for GPS + QZS was 2.44 m. Although the height results are not presented in this paper, it can be seen that the height results deviate greatly for a short period in the case of GPS + QZS. Further investigation of these issues can be expected with the use data for a very long time-period.
General RTK performance in urban areas
Algorithm of RTK used in this paper
In this paper, LAMBDA method is used to search for correct ambiguities because this technique is able to search for the best solution using the integer least-squares method [4]. It is quite important to resolve the ambiguities in a single epoch in urban areas because there is no influence when cycle slips in the carrier phase take place in the phase-lock loop. In this paper, a single epoch solution is used. No multi-epoch solution or filtering methods are used. A Ratio test is used to determine whether the ambiguities produced by the LAMBDA method are acceptable. The general threshold for the Ratio test is set according to [5].
RTK performance under open-sky conditions
Single-epoch RTK performance under open-sky conditions was investigated using the reference stations of GEONET (GPS Earth Observation Network), which are operated by the Geographical Information Authority of Japan. GEONET, which consists of 1200 permanent GPS stations, is the largest GPS network in the world. Hamaoka 1 was set the reference station. Daito 2 was set as the rover station. The baseline was about 8 km. Observation data for one week were used in this analysis. The mask angle was set at 30° because RTK performance under low visible satellites must be checked in this case. Table 2 shows the results for the correct fixing rate in each NVS (number of visible satellites) according to the threshold of the Ratio test. The first line shows the NVS, and the first row shows the threshold of the Ratio test. As these results clearly show, the level of performance depends on the NVS, even under open-sky conditions. Even when the threshold for the Ratio test was set at 3, the performance was approximately 96% when the NVS was 4. On the other hand, the correct fixing rate with five or more visible satellites was clearly over 99%.
RTK performance in dense urban areas
The NVS of GPS in urban areas was investigated in order to determine the satellite’s visibility in urban areas. Raw GPS data accumulated over 12 h was used in this analysis. These raw data were obtained by car in Tokyo. Table 3 shows the NVS percentage in total epochs. The GPS receiver used in this study was a NovAtel OEM4.
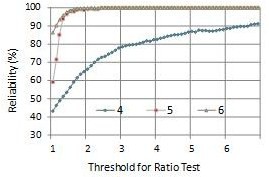
The ratio in which the NVS is less than 4 accounts for 20%. The ratio in which the NVS is more than 4 accounts for 64%. It is thus easy to conclude that the environment in urban areas is not good for RTK. In addition, the relationships between the NVS and the reliability of RTK were investigated. Figure 8 shows the relationships between the percentage of epochs within a 1m error and the threshold of the Ratio test according to the NVS. These raw data were obtained by car for 30 min in the center of Nagoya. As reference positions, POSLV was used in this test [6]. This reference-positioning system guarantees an accuracy of about 10 cm in this test. The blue line shows the case in which the NVS is 4. Each line is classified by the NVS in the same manner. It is surprising that the reliability within a 1m error was only 89% when the threshold of the Ratio test is set at 3 in the case of NVS = 4. On the other hand, with five or more visible satellites, the reliability was maintained at over 99% as long as the threshold of the Ratio test is set at 3. Based on these results, it is expected that the role of QZS will be quite important for urban navigation because the ratio in which the NVS is 4 in the case of GPS accounts for 20%, as shown by the above statistical data from Tokyo.
Experimental results
The experimental results are presented in the following sections.
Stand-alone positioning results
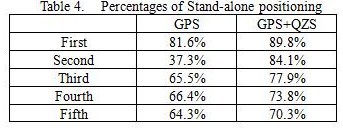
The temporal visibility of satellites in dense urban areas was investigated. As an indicator, the percentage of stand-alone positioning was checked using raw data that were obtained in the vicinity of Shinjuku Station in Tokyo on January 12, 2011. This location is quite suitable for this test because it has many high-rise buildings. Figure 9 shows the route of the test course which took about 25 min to circumnavigate. From 09:00 AM to 12:00 PM, five tests were conducted along the same route. The GPS receiver used in this test was a JAVAD DELTA and the antenna was also a JAVAD GrAnt. This receiver is able to output raw data not only GPS and QZS, but also GLONASS and Galileo. Table 4 shows the percentages of stand-alone positioning in each test. The mask angle was set at 10° and the minimum carrier-to-noise ratio was set at 30 dBHz.
The results clearly show that the addition of one QZS improves the availability of stand-alone positioning. In the second test in particular, the degree of availability improves from 37 % to 84 %. This means that the NVS was almost 3 during the second period with only GPS. Such a situation frequently takes place in the major cities of Japan, so it can be said that QZS offers a great advantage in dense urban areas. Moreover, it can be said that it is quite important for a general consumer receiver that has only the L1 frequency to have increased availability of stand-alone positioning.
RTK results
Two RTK experiments are described in the following two sections. The receiver and antenna used in these tests are exactly the same as those used in the test described in Section 4.1. Carrier smoothing in the receiver was set at 100 s. The reference station was set on the roof top of our laboratory and 1-Hz raw data were obtained. 5-Hz raw data were obtained in a car. The mask angle was set at 10° and the minimum carrier-to -noise ratio was set at 30 dBHz. The minimum HDOP was set at 10. Another signal-quality check was also conducted using carrier-to-noise ratio information. This checking process was quite simple, its details are given in reference [7].
First test
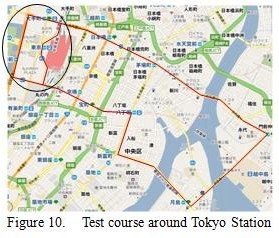
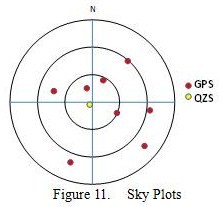
A car equipped with receiver and antenna followed a route from our university to Tokyo Station. Except for the area around the university, the route passed among many high-rise buildings and included several overpasses. The raw data were obtained from 10:50 AM to 11:30 AM on March 1, 2011. The total number of epochs was about 12 000. Figure 10 shows the route of this test. The area enclosed in the black line is the central business district, which include many skyscrapers. Figure 11 shows the sky plots of GPS+QZS in this period. The elevation angle of QZS was 85° or more and the GPS allocation was also ample.
Table 5 summarizes the availability of pseudo-range DGPS and the fixing rate for RTK. In RTK, the solutions that satisfy the Ratio test were regarded as fixing solutions. The threshold for the Ratio test was set at 3. As can be seen in Table 5, the availability of DGPS improved from 81% to 93%. Looking at the RTK performance, we see that the fixing rate improved dramatically from 27% to 52%. Furthermore, the fixing rate improved from 46% to 70% even in the case of Doppler support RTK. It is notable that the fixing rate improved approximately 25% with the addition of only one satellite, namely QZS. The details of the Doppler support RTK are given in reference [8]. The results of Doppler support RTK revealed that the maximum period of continuous non-fixing was 140 s in the case of GPS only. On the other hand, the maximum period of continuous non-fixing was 45 s in the case of GPS + QZS. These results indicate that QZS will contribute not only to RTK performance but also to the coupling of GNSS with INS.
Second test
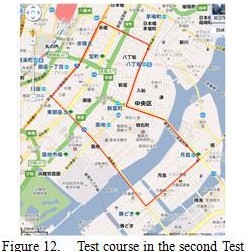
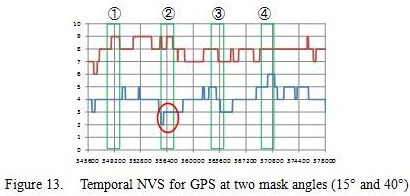
This section shows the results from the viewpoint of QZS elevation change. The test route is surrounded by many high-rise buildings and the street is wide. The raw data were obtained by car on four occasions on March 24, 2011. Figure 12 shows the route of this test; the same route was used for all four events. Figure 13 shows the transition of the NVS for GPS during this test. The red line shows the temporal NVS in the case where the mask angle was set at 15°, and the blue line in the case that of 40°. There were 4 events in the green square that is shown. During this period, the elevation of QZS was changed from 80°, 60°, 40° and 15°. Table 6 summarizes the availability of pseudo-range DGPS along with the fixing rate for RTK as compared with GPS and with GPS + QZS. In each column, the left side shows the results of GPS and the right side shows the results of GPS + QZS. As these test results show, the advantage of GPS + QZS was clear. Although the fixing rate was low in the second period, the reason for this is that the NVS over 40° for GPS was low. Also, the last test shows that the GPS performance exceeds the performance of GPS + QZS. The reason for this is that a positive contribution from QZS cannot be expected in this period because of low elevation-angle. Sometimes low-elevation satellite is not good for precise positioning.
Conclusion
The contributions of QZS to precise positioning were investigated in this paper. Although we cannot solve a position using only QZS, our results showed that adding QZS to GPS was quite effective for navigation under difficult conditions. The availability of stand-alone positioning was improved, even within cluster of high-rise buildings. Also, the availability of precise RTK positioning was significantly improved in dense urban areas. For QZS, it is possible that after further satellites are launched, further improvement of its performance in dense urban areas can be expected.
Acknowledgement
The authors wish to acknowledge the contributions to this study by Toyota Central R&D Laboratories.
References
[1] Quasi-Zenith Satellite System Navigation Service Interface Specifications for QZSS (IS-QZSS Ver.1.2 Draft)
[2] N. Kubo, F. Wu, and A. Yasuda: Integral GPS and QZSS Ambiguity Resolution, Trans. Jpn Soc. Aero. Space Sci. Vol. 47, No. 155, pp. 38-43, 2004
[3] IS-GPS-200, Revision E, (http://www.gps.gov/technical/icwg/IS-GPS-200E.pdf), 2010
[4] P. J. G. Teunnissen: The Least-Square Ambiguity Decorrelation Adjustment: A Method for Fast GPS Integer Ambiguity Estimation, J. Geodesy, Vol. 70, Nos. 1-2, pp. 65-82, 1995.
[5] P. J. G. Teunnissen, S. Verhagen: On GNSS Ambiguity Acceptance Tests, Proceedings of IGNSS Symposium 2007, Dec. 4-6, 2007, Sydney.
[6] POSLV (http://www.applanix.com/products/land/pos-lv.html)
[7] N. Kubo, A. Yasuda, R. Shibazaki: An Effective Multipath Mitigation Technique under Strong Multipath Environments, The 2005 International Symposium on GPS/GNSS 8-10 December 2005, Hong Kong.
[8] N. Kubo, S. Pullen: Instantaneous RTK Positioning Based on User Velocity Measurements, Proceedings of ION GNSS 2008, Sept. 16-19, 2008, Savannah, Georgia, pp. 1406-1417.
My Coordinates |
EDITORIAL |
|
His Coordinates |
Dr Shailesh Nayak |
|
Mark your calendar |
July 2011 TO December 2011 |
|
News |
INDUSTRY | LBS | GPS | GIS | REMOTE SENSING | GALILEO UPDATE |







 (2 votes, average: 3.00 out of 5)


Leave your response!