| Geodesy | |
On the high precision prediction of short-term polar motion
Combinational model of least squares and ARMA (p,q) has been applied to predict polar motion |
 |
|
 |
|
Polar motion refers to the earth rotation axis and surface intersection point’s slow moving on the earth surface [1], realtime acquisition of polar motion is of great signifi cance to high precision satellite navigation, satellite laser ranging and deep space exploration. At present, the international high accuracy polar motion value is obtained through VLBI and SLR technology observation data calculation. Due to its complicated calculating process, we cannot get real-time results, often need a delay of 2~5 days. Because of this condition, high precision short-term polar motion prediction has very important practical signifi cance; therefore many scholars have put forward various methods to forecast the polar motion value [2-7]. These methods mainly use least squares algorithm to fi t the polar motion’s sure part and establish extrapolation model fi rstly, and then predict the stochastic part by employing artifi cial neural network model [2], Auto-Regressive model[7] and so on, fi nally add the least squares extrapolated value and the prediction value of s tochastic part and take it as the forecasting polar motion value.
We find that Auto-Regressive and Moving Average Model can best fi t the stochastic part of polar motion when we analyze the polar motion’s stochastic part time series, thus this paper try to employ LS+ARMA(p,q) model to forecast polar motion value.
LS+ARMA(p,q) model
LS model
The sure part of polar motion is consist of long-time trends, C handler Wobble, A nnual Wobble and Semi-Annual Wobble, thus the polar motion X and Y component can be expressed like formulas (1), (2).
We can get least squares model of polar motion sure part based on parameters which can be calculated form formula (4).
ARMA(p,q) model
Analytically, consecutive values of polar motion stochastic part have dependency re lationship, and ARMA(p,q) model can ‘remember’ the dependency relationship of time-series well [8], we can use its memory performance to forecast values in the future. ARMA (p,q) model can be expressed in formula (5).
Where Yt(t=1,2,…)represent polar motion stochastic part values, et(t=1,2,…) represent white noises, p and q indicate model orders,
φi(i=1,2,…, p) and θi (i=1,2,…, q) indicate model parameters.
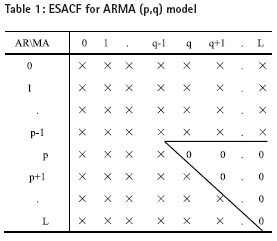
Model orders and parameters need to be estimated if we want to establish a ARMA (p,q) model. There are some ways to determine model orders, such as minimum error variance criteria, AIC criter ia, BIC criteria, ESACF criteria[9] a nd so on, this paper employ ESACF criteria to estimate model orders p and q. ESACF is a kind of consistent estimate based on AR part parameters, and it does not require high stationarity of the process. In the estimate part, ESACF adopt iterative stepwise regression method. And we can acquire model orders by using ‘Triangular truncation’ of ESACF. As a example, the ESACF of ARMA (p,q) is given in Tab.1. Parameters of the ARMA (p,q) model must be calculated after the model orders is determined. There are also some methods we can use to estimate them, such as moment estimation method, maximum likelihood estimation method and least squares method and so on, this paper employ least squares method to estimate the parameters of the model. Stochastic part of polar motion can be forecasted when the model orders and parameters are estimated.
Numerical example
Standard for precision evaluation
This paper employs Root Mean Square Error (RMSE) and Mean Absolute Error (MAE) to evaluate the predicted polar motion values. Their calculation formulas are formula (6) and formula (7).

Where Pj indicates predicted polar motion value at t ime interval j, Oj indicates real polar motion value at time j, i indicates fo recasting span,
RMSEi indicates RMSE for i forecasting span, MAEi indicates MAE for i forecasting span.
Optimum length of fi tting data for prediction
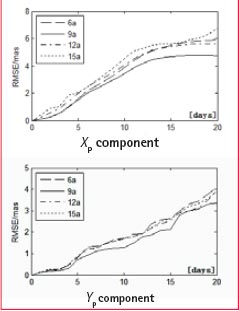
This paper forecasts polar motion values at a span of 1~20 days on the periods from Ja nuary 1, 2005 to December 20, 2011 by using 6,9,12 and 15 years data before prediction period. Figure 1 shows the accuracy statistics. From Figure 1, we see that 9 years fi tting data is the best length of fi tting data to forecast polar motion values, therefore we use 9 years data to establish models. We also see that forecasting accuracy by using 6, 12, 15 years data is lower than by using 9 years data. It mainly owing to on one hand short-term data cannot effectively weaken observation errors’ infl uence, on the other hand long-term data cannot reflect time varying feature [10] of Chandler Wobble and Annual Wobble. Thus appropriate length-selection of the fitting data is very important.
Figure 1: Prediction RMSE of Models Based on Different Length of Fitting Data
Accuracy-Comparison with other prediction models
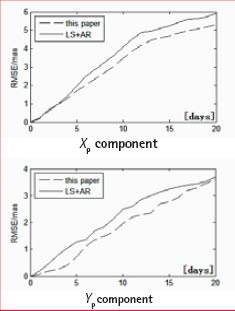
In order to test the superiority of LS+ARMA (p,q) model, we forecast polar motion values at a span of 1~20 days by using the method in this paper and other methods on the same condition. Figure 2 shows the results statistics on the period from January 1, 2005 to December 20, 2011.
From Figure 2, we can see that higher accuracy can be got from the LS+ARMA (p,q) model than LS+AR model.
Figure 2: Prediction RMSE comparison with LS+AR model
To further prove feasibility of LS+ARMA(p,q) model, this paper try to forecast polar motion values on period from October 2005 to February 2008 (the same period with EOP PCC [11]which was launched by Schuh.etc in 2005). And we compare the results with EOP PCC in Figure 3 (different color lines represent different forecasting results in EOP PCC results). From Figure 3 we see that this paper’s result is equivalent to the best result of EOP PCC, thus we can use LS+ARMA (p,q) model to predict short-term polar motion values.
Figure 3: Prediction MAE comparison with EOP PCC
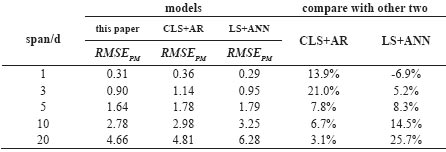
In addition, we compare forecasting accuracy o f LS+ARMA (p,q) model and accuracy of CLS+AR model[6], LS+ANN model[2], we use the same prediction period and precision evaluation with article[6] and article[2]. The results are shown in Table 2, in Table 2, RMSEPM is calculated in formula (8).
Table 2 Prediction RMSE comparison with CLS+AR and LS+ANN model
Where RMSEX indicates RMSE of X component, RMSEY indicates RMSE of Y component. From Tab.2 we can see that accuracy of LS+ARMA(p,q) model is higher than other two models except that 1 day span prediction is lower than LS+ANN model.
Conclusions
This paper uses LS+ARMA (p,q) to forecast polar motion values, numerical experiment shows its advantages and applicability. But we fi nd that it’s only suitable for short-term forecast. When the span is longer than 20 days, its accuracy is lower than other models. Physical motivating factors of polar motion have not been discussed in this paper, we only employ polar motion time series to forecast. These factors will be combined to forecast polar motion in the near future.
Acknowledgments
This research was funded by the national ‘863 Project’ of China (No. 2008AA12Z308) and National Natural Science Foundation of China (No. 40974003).
References
[1] Zhenghang LI, Erhu WEI, et al. Space Geodesy[M], Wuhan: Wuhan University Press, 2010.
[2] Kosek W, Kalarus M, Niedzielski T.Forecasting of the Earth Orientation Parameters: Comparison of different Algorithms[C]. The Celestial Reference Frame for the Future, Paris, 2008.
[3] Schuh H, et al. Prediction of Earth orientation parameters by artifi cial neural networks [J]. Journal of Geodesy, 2004, 78:274-258
[4] Zhu SY. Prediction of Earth rotation and polar motion [J]. Bull Geod., 1982, 56:258-273
[5] Chao B F. Predictability of the Earth’s polar motion [J]. Bull Geod., 1985, 59:81-93
[6] Hao Zhang, et al.Application of CLS+AR Model Polar Motion to Prediction Based on Time-Varying Parameters Correction of Chandler Wobble [J]. Geomatics and Information Science of Wuhan University, 2012,37(3):286-289.
[7] Feng Yan, Yibin Yao. Short-Term prediction methods and realization of the earth rotation parameters [J]. Journal of Geodesy and Geodynamics, 2012,32(4):31-35.
[8] S.M. Pandit, Xianmin Wu, et al. Time Series and System Analysis and Application[M].Beijing: Machinery Industry Press,1988.
[9] Jonathan D.Cryer, Kung-Sik Chan. Time Series Analysis with Application in R. Second Edition[M]. Berlin: Springer,2008.
[10] Kosek W, McCarthy D D, Luzum B J. EI Nino Impact on Polar Motion Prediction Errors[J]. Studia Geophysica et Geodaetica , 2001,45:347-361.
[11] Kalarus M, Schuh H, Kosek W, et al. Current results of the Earth orientation parameters prediction comparison campaign [J]. JGeod, 2010,84:587.
My Coordinates |
EDITORIAL |
|
His Coordinates |
Dr M V Rao, Dr V Madhava Rao, Dr S K Singh |
|
Conference |
“We can’t leave our security to any other country” |
|
Mark your calendar |
February 2013 To August 2013 |
|
News |
INDUSTRY |GNSS | GIS | IMAGING | GALILEO UPDATE |


 (6 votes, average: 3.33 out of 5)


Leave your response!