| LBS | |
How to measure traffic jam?
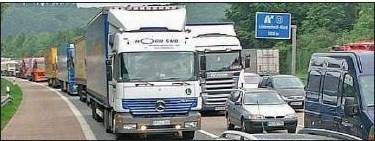
As traffic jam is getting a bad reality in our times, realistic information on the traffic situation together with optimized routing to reduce overall waiting time on the trip become more and more valuable all over the world. But how to vlaidate, if the information provided is reliable and trutsworthy? On the first look, this sounds easy, but as truth is in the details, a lot of hurdles have to be passed for a successful finish. |
|
 |
|
||||
 In many countries traffic information is distributed via radio broadcast and provides information on location and length of traffic jam. Only if a road is completely blocked then a deviation is recommended. In most European countries TMC (Traffic Message Channel) is used to provide in a digital way all available information on road situation directly into radios equipped with TMC. As this information is based on alerts from police or other drivers, the experience is that the information about a traffic jam is available after some time. However typically a traffic jam is still reported for at least 20 minutes after free flow occurs. As such the attitude is to stay on the road with the jam, pass the jam and hope that time delay will not be too long.

These free services are complemented by paid services which are offered by car manufacturers, navigation provider or dedicated service companies. They claim that they provide a higher quality. In addition to location and length of the traffic jam they deliver also the expected delay time. Now it should be possible to drive not only the longest, shortest or most economic route but also one with the shortest driving time, if the information is reflecting ground truth.
In order to improve the quality it is necessary to monitor the status and to identify if a change is increasing or decreasing the overall quality. For traffic information systems no common criteria do exist. As such we have defined KPIs (Key Performance Indicators) to assure that the user expectation is measured. First it is important to know if a traffic jam exists or not. So the first KPI is the jam accuracy. This parameter identifies the ratio between jams reported correctly and the number of all actual traffic jams. To avoid that a traffic information system is achieving a too high scoring by just indicating for all roads the existence of traffic jam the second KPI is the message delivery ratio. This is defined as the ratio between correctly reported jams and number of all reports by the specific information system. From a user perspective to be informed only about the existence of a traffic jam is not sufficient. The user expects to get guidance on his actions based on the existence of the traffic jam. A typical scenario is that due to the information – traffic jam on a highway – drivers decide to leave the highway and take a detour on cross country roads or even urban roads with the expectations to be faster than staying on the highway. However the underlying assumption is that there is no traffic jam on the intended detour as the traffic information system does not report any incident for these roads. Thus it is important to know the coverage of the traffic information system with respect to road coverage. This KPI is defined as the identification of incidents for various road classes, to measure if only highways or also roads of minor classes are monitored. The most important information to the user however is the reliability of the provided information with respect to the reported length of a traffic jam and the expected delay time. This jam reliability is defined as the ratio between reported length and delay to actual length and delay.
The monitoring of KPIs allows the qualification of achieved results over a period of time. The challenge however in the context of traffic information systems is how to measure the KPIs as the objects to be measured are not static nor can they be evaluated inside a laboratory. The methods used should provide the same objectivity as those achieved within a laboratory. For test laboratories the standard for quality management systems, the ISO/IEC 17025:2005 defines the requirements on the competence of testing laboratories to carry out tests. Emphasis is put in this standard aside of general quality management aspects to the validation of test methods especially if the laboratory has developed its own and on the estimation of the uncertainty of measurement in order to assure the reliability of the test results. This standard refers to the ISO 5725 which deals with the accuracy (trueness and precision) of measurement results.
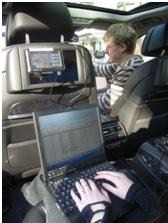
Looking to the measurement to the above defined KPI it is required to some extend to know the accuracy with which the measurement of an incident takes place. The measurement can be performed in two different ways, one being an observer and the other being part of the system both having its specific pros and cons. To validate the existence of a  reported incidence at a given time, one has to be outside of the incident to confirm the existence of the incident. As being part of the system as a driver it cannot be validated if a reported incident does exist or not at the reported moment. Only at a later time arriving at the location of the reported incident, one can being part of the system identify if the information provided was correct or not, as the incident might have changed in the meantime – disappearance or new incident at the reported location. However typically today the ground truth is collected by cars, driving on roads with specific equipment on board, to monitor speed and location during the trip.
If a traffic information system provides information (length and expected delay) of an incident, the independent observer can better measure the length of the incident at the time the information was provided. As part of the system the length of an incident is measured by passing by the incident. As such the length cannot be measured prior to being part of the incident. During the time required to pass the incident, the length might have changed resulting into deviation between measured and reported length not implying in any case a wrong reported value. However even an independent observer is not able to measure the reported duration of the delay because both measurement methods require to wait that a vehicle is passing the incident from start to end location. Again in this situation the reported duration may change due to system and measurement extrinsic factors.
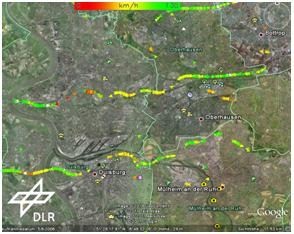
The major disadvantage of the independent observer is that he only has a limited observation area and that this area cannot be adjusted ad hoc to allow flexible adjustments of test areas. Typically a high position like a bridge is used to monitor in real time traffic either via a camera or via a person. In best case the view allows to monitor the road for a length of one kilometre. There is a new innovative approach to measure ground truth via satellites. The measurements  from the satellite allow identifying individual vehicles on selected roads. The speed of the vehicles can be identified individually with a resolution of about 5 km/h or better. As such one has a snapshot available which can be used to calibrate existing equipment like road loops to assure that the provided results on the speed of the vehicle is correct. It can also be used to validate the user experience of the length of a traffic jam at a given time. At the time being the results are quite promising but a long way have to be progressed to achieve required reproducibility and reliability.
We have now identified KPIs which reflect the achieved quality and based on ISO/EN 17025 a proper methodology for measurements has been identified. However an optimum way to measure cost effectively ground truth does not exist. A way forward is to perform an audit of the service provider offering traffic information. In this audit are analyzed to assure that the received input will generate the expected output. This is complementing the ISO 900. As such in all phases in which data processing takes place have to be analyzed:
Data collection
Data fusion
Data processing
Data provided by third parties
Integration of traffic information
Verification of traffic information
Qualification of traffic information
Storage of traffic information
As a result the overall process will be optimized by identifying critical paths and validation of (complex) processes. Weak points are identified and can be eliminated increasing the overall performance.
My Coordinates |
EDITORIAL |
|
Mark your calendar |
August 2011 TO December 2011 |
|
News |
INDUSTRY | LBS | GPS | GIS | REMOTE SENSING | GALILEO UPDATE |


 (1 votes, average: 1.00 out of 5)


Leave your response!