| Mapping | |
Exploring the moon in three dimension
P K Srivastava B Gopala Krishna and Amitabh
|
||||||||||||||||||||||||||||||
| There are four possibilities of stereo image processing for the DEM generation. The combinations are Fore – Aft, Fore- Nadir, Aft – Nadir and Fore-Aft-Nadir images as a pair. Out of many cases, an area in the south polar region acquired on 15-11-2008 is given here as a sample case for DEM generation. The region is a part of the crater Moretus with location -70.6 deg lat and -1.4 deg long.
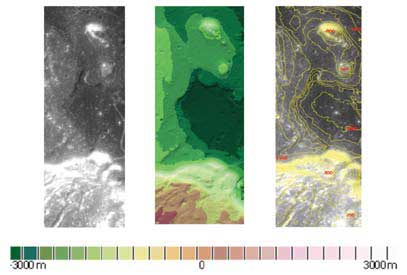
The DEM generated for all the cases are shown in figure-3. The three camera triplet image (Fore-Aft-Nadir, figure-3e) produced the best matching results with 100 % success in point matching while nearly 87% success in pattern matching. Due to the relatively large angles between FORE and AFT the matching was poor, which was shown as dark points in the DEM (figure -3c). A colour coding of the DEM is also shown in figure-3f, which clearly show the height range of the crater from -1500m to 4000 m with respect to the mean radial surface of the moon. A large strip of 1800 km (location: Coulomb C crater) has been divided into 3 individual strips of 600 km and DEMs have been derived for all three strips separately. This break up is done to reduce the processing time in DEM generation. The DEMs and their visualisations are shown in figures-5, 6 and 7. Lunar Atlas [2, 3] with TMC DataThe high level data products defined for Chandrayaan-1 mission are the Lunar Atlas and maps. The objective of Chnadrayaan-1 lunar atlas and map products are to prepare maps for the entire surface (~37.8 Million Sq. km) of moon and it’s visualisation. Atlas will consist of Terrain Mapping Camera (TMC) and Hyper Spectral (HySI) orthoimage and Image mosaics, Digital elevation model derived from TMC triplets, Contributory themes from each payloads and annotations. Lunar atlas will be in softcopy while in the hardcopy form it will be represented in map catalogue form. Maps of earth’s surface have been produced primarily by piecing together large-scale sketches and diagrams since centuries. Control networks were derived through extensive and laborious ground surveying. By the late nineteenth century, regional maps were produced in this fashion that was relatively accurate. With twentiethcentury technology, the ability to obtain the synoptic view has emerged. Photographs taken from earth-orbiting satellites enabled the rapid production of accurate maps. When combined with well established control networks, these maps have enabled surface features on earth to be located precisely. Planetary explorers, on the other hand, have had the global perspective from the beginning, and they have progressed from global, through regional, to local vantages. The naming of features is as much a part of map making as is the measuring and plotting of their locations. Without names, communication of ideas is impossible. The names applied by explorers on earth often bear their provincial outlook. Ambiguities abound; settles on different parts of the same river often know the river by different names. The tradition that the privilege of naming belongs to the discoverer resulted in hopeless ambiguities, redundancies and inconsistencies. The International Astronomical Union (IAU) has therefore assumed control of the naming process. It’s working groups are composed of planetary scientists from many nations. The main inputs for the planned lunar atlas from Chandrayaan- 1 are the DEM and Orthoimages from TMC and other associated layers from the other payload data along with annotations. The absolute accuracy of the Lunar DEM in turn depends on the basic control used in the modelling the imaging geometry. As the initial results show, it is possible to derive relatively accurate DEMs from Chandrayaan-1 TMC imagery, which is the prime input for DEM generation towards Lunar Atlas preparation. Three CCD imagery in the triplet form, when compared to stereo pair leads to a good DEM in terms of detail due to the better point and pattern matching accuracies. The DEMs at 25 m grid interval depicts a very good representation of the terrain, which can be a prime input to the science analysis, when used along with the other payload data sets from Chandrayaan-1, in addition to its usage in the 3D mapping of moon. Figure-5: Orthoimage, DEM with colour coding and Visualisation of Image draped over DEM (Coulomb C Crater) Figure-6: Part of Mare Orientale (a) Orthoimage (b) colour coded DEM (20 km x 65 km long) (c) Contour Image Reference:1. A quest for moon, Narendra Bhandari, Current Science, Vol. 83, No.4, 25 August 2002 2. Lunar Cartographic Dossier Vol-1, Lawrence A. Schimerman, NASA , 1973 3. Planetary Mapping, Ronald Greeley and Raymond M. Batson; Cambridge University Press 1991 4. Scientific Challenges of Chandrayaan- 1:The Indian Lunar polar orbiter mission, Narendra Bhandari, Vol. 86, No. 11, 10 June 2004 5. ISRO page: http://www.isro.gov.in 6. webgis.wr.usgs.gov/download/ClementineUVVIS/Mosaic 7. webgis.wr.usgs.gov/download/ ClementineUVVIS ULCN2005.warp |
||||||||||||||||||||||||||||||
|
||||||||||||||||||||||||||||||
|
Pages: 1 2


 (No Ratings Yet)


