| GNSS, Mycoordinates | |
Couldn’t we predict the Wenchuan Earthquake with GPSps?
|
||||||||||||||||||||
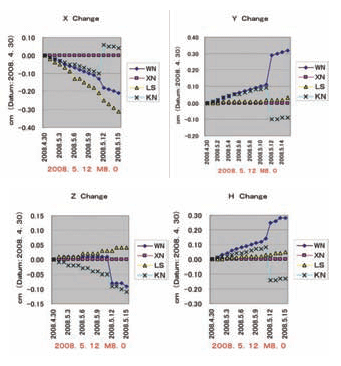
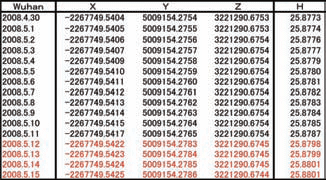
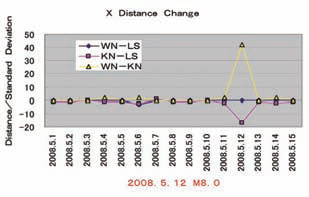
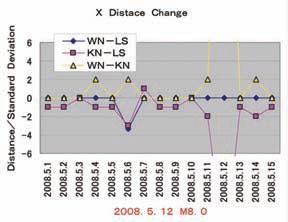
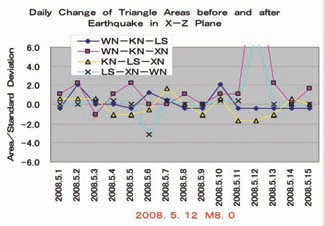
The Wenchuan Earthquake occurred in Sichuan Province, China on the 12th May 2008 with M 8.0 in Richter Scale and 10km depth which resulted in more than 90,000 dead and missing. It is reported that the total loss is more than 170 Billion US Dollars. Figure 1 GPS Stations and Epicenter ©Murai & Araki 2008 Why couldn’t we predict the earthquake? The prediction of earthquake has been one of the most difficult sciences which are not yet solved. The authors have traced many past earthquakes happened in Japan with use of GPS data since 2000. There were 162 earthquakes with more than M6.0 around Japan including offshore for eight years from January 2000 to December 2007. We found some kind of pre-signals to all those earthquakes in GPS data in terms of daily change of triangle area connecting fixed GPS stations constructed by Geographic Survey Institute (GSI) of Japan. Figure 2 Change of 3D coordinates and Ellipsoidal Height ©Murai & Araki2008 Table 1 3D coordinates and height at Wuhanbefore and after the WenchuanEq. ©Murai & Araki2008 Though limited number of GPS stations near the origin of the Wenchuan Earthquake is available, we tried to find pre-signals from GPS data which are provided by International GPS Service (IGS) and Scripps Orbit and Orbit Permanent Array Center (SOPAC). Four GPS stations are selected; Wuhan (WN), Xian (XN), Kunmin (KN) and Lhasa (LS) for the processing as shown in Figure 1. We found critical pre-signals in daily change of distances and triangle areas, six days before the Wenchuan Earthquake. How much did GPS stations move at and after the Earthquake?Though the change of 3D coordinates of GPS stations are not useful for the prediction as known from our experience, it would be interesting to know how much GPS stations moved after the Earthquake.Figure 2 shows the change of 3D geocentric coordinates (X, Y, Z) and ellipsoidal height (H) at four GPS stations every three days from 2008.4.30. It is shown that Wuhan moved drastically in all directions after the Earthquake. Table 1 shows the 3D geocentric coordinates and ellipsoidal height at Wuhan GPS stations which moved largest. The biggest change was 2mm in Y direction at the earthquake. Kunmin showed the large reverse movement (from positive to negative or from negative to positive) in X, Y and H directions after the earthquake. How much did the distances between GPS stations move?The daily changes for six combinations of distances connecting the four GPS stations were checked for 15 days from 2008.5.1 to 2008.5.15. Out of six combinations, the two distances between Wuhan and Lhasa and between Kunmin nad Lhasa showed the largest daily change with more than 3 sigma on the 6th May, six days before the earthquake though the distance between Wuhan and Kunmin showed the biggest change on the day of the Earthquake as Figure 3 Change of X direction distance at three base lines ©Murai & Araki2008 Figure 4 Normalized Change of Distances of three Baselines( WN-LS and KN-LS showed over 3 sigma) ©Murai & Araki2008 Figure 5 Daily Change of Triangle Area before and afterthe Earthquake in XZ Plane (LS-XNWN showed over 3 sigma)v ©Murai & Araki2008 shown in Figure 3. The vertical axis shows normalized value of distance divided by the standard deviation. Figure 4 showed the detail of the daily distance change in X direction for the distance between Wuhan and Lhasa and between Kunmin and Lhasa, which showed the drastic change of larger than three sigma on the 6th May, six days before the earthquake. The problem of the distance abnormality will not to be able to identify where the relevant earthquake may occur. How much did the triangle areas connecting GPS stations change?The four combinations of triangles connecting four GPS stations were checked whether any pre-signals were found or not before the Earthquake. The triangles were checked for XY, XZ and YZ planes for 15 days from 2008.5.1 to 2008.5.15. Figure 5 shows the XZ plane in which the triangle connecting Lhasa, Xian and Wuhan showed 3 sigma abnormalities on the 6th May 2008. This triangle includes the epicenter of the Wenchuan Earthquake as shown in Figure 1. Though this triangle is so large with the longest side of more than 2000km, it would be valuable to know around where an earthquake may happen within a critical triangle area. ConclusionsPre-signals of the Wenchuan Earthquake existed in the daily change of distance between GPS stations; Wuhan to Lhasa and Kunmin to Lhasa with larger than 3 sigma on the 6th May 2008, six days before the Earthquake. Similar presignals larger than 3 sigma existed in the daily change of the triangle area; Lhasa- Xian-Wuhan on the 6th May 2008, also six days before the Earthquake. The epicenter of the Wenchuan Earthquake is included in the critical triangle. |
||||||||||||||||||||
|
||||||||||||||||||||
|




 (2 votes, average: 4.00 out of 5)


Leave your response!