| Geodesy | |
Conventional and ‘Satlevel’ collocation model for production of contour map
A case study of Yanbu industrial city |
 |
|
 |
|
 |
|
Acontour map is made up of contour lines and depicts the shape of any portion of the earth surface. A contour line is an imaginary line drawn on the map to connect points with the same elevation or height, above or below the earth surface to form a continuous line shown in brown colour on the map.
Historically, different types of maps were produced for the Kingdom by the foreign agencies, educational institutions and governments. These maps include but are not limited to the following: Historical city maps of Mecca, Al- Madinah and Riyadh from Western Arabia and the Red Sea were produced by the Naval Intelligence Division of the Great Britain in 1946; while those of Dharan, Jeddah and Riyadh were produced by the United States of America (U.S) Department of State 1983 and 1986. Furthermore, the shaded relief map of Saudi Arabia was produced in 1974, reviewed in 1991 and 2003 by the Central Intelligence Agency (CIA) of United States. Thematic map from CIA Atlas of the Middle East was produced in 1993. Topographical maps which include contour were produced as part of Operation Navigational chart series by U.S. Defence Mapping Agency Aerospace Centre. Recently, the US National Imagery and Mapping Agency produced the topographical maps of Saudi Arabia in a scale of 1:250,000 [PCL, 2012].
Presently, the Ministry of Municipal and Rural Affairs (MOMRA) is currently handling mapping and mapping related activities in the Kingdom. [Baris, 2012] Apart from production of maps in different scales, different maps are produced depending on the need and purposes by other agencies such as the General Commission for Survey (GCS). King Abdulaziz City for Science and Technology (KACST), Royal Commission for Jubail and Yanbu, Saudi Geological Survey, companies like the Saudi Aramco, Schlumpberger Consulting Engineers Inc., educational institutions such as King Saud University, King Abdulaziz University, Yanbu Industrial Colleges and others with Geomatics and GIS related disciplines.
In Yanbu Industrial City, the Urban Planning Department of the Royal Commission for Jubail and Yanbu, Royal Commission at Yanbu is currently handling all issues of Survey and Mapping under the Survey section that comprises CAD and GIS sections. The Department produces different types of maps, which include topographical map that contained the contours either as a direct labour or contract to reputable mapping companies.
The contour maps, like most complex ones, are designed using index contours. Contour lines are shown in brown colour with the value of height written on it. The height is typically measured with reference to a known Datum. The datum usually adopted is the geoid [Aleem, 2011 and Williams, 2012].
The geoid is the surface which coincides with that surface to which the oceans would conform over the entire earth, if free to adjust to the combined effect of the earth’s mass attraction (gravitation) and the centrifugal force of the Earth’s rotation. Specifically, it is an equipotential surface, meaning that it is a surface on which the gravitational potential energy has the same value everywhere with respect to gravity. The geoid surface is irregular, but considerably smoother than the earth’s physical surface. The sea level, if undisturbed by tides, currents and weather, would assume a surface equal to the geoid when the observation is carried out for a numbers of years, usually 18.61years. [Aleem, 1996, Olaleye et al 2010; Olaleye et al 2011 Aleem, 2013]
Determination of the geoid has been one of major challenges for geodesists. Gravity data have been used in the past with stokes integration and other approaches. These methods are time consuming, expensive and laborious. GNSS provide WGS84 ellipsoidal heights and when compared with orthometric height from geodetic levelling, allows for the computation of the geoid, or the geoid-ellipsoid separation in the region of the survey [5, 6, 7 & 8]. These height differences were used to derive the geoidal models called ‘Satlevel’ Collocation model [Aleem,2013].
The geoid model will give geoidal undulation at every point of observation. This can be substituted with the ellipsoidal height from GNSS observation to get the orthometric height has given in Equation 1.1[Aleem, 1996, Olaleye et al 2010; Olaleye et al 2011 Aleem, 2013]:
H = h – N (1)
Where:
H = Orthometric height
h = Ellipsoidal height
N = The Geoid-Ellipsoid separation Geoidal undulation
From the above Equation 1, orthometric height can be computed, which can be plotted on the map as spot heights. The spot heights can be interpolated to produce the contours.
Interpolation of contour
Traditionally, interpolations of contours are often done by rough estimate. The procedure is to first plot all the available spot heights on the map and estimate the point for the contour. However, a more accurate but time consuming method that used to be adopted is the following formula [3]:
Where:
PC is distance to the point of contour
D is the distance between two spot heights
Z is the difference between the two spot heights
i is the difference between the contour and one of the spot heights.
Distance PC will then be scaled and marked on the map, which will later be connected to form the contour. The use of information technology in surveying and geoinformatics has made the use of software a part of geomatics. Contour maps are nowadays prepared easily with these software.
Contour map software
There are different types of software in the market for production of contour, digital terrain and three dimensional surface model of any part of the world. This study used AutoCAD Civil 3D software.
AutoCAD Civil 3D
A surface in Civil 3D is built on the basis of mathematical principles of planar geometry. Each face of a surface is based on three points within a circumcircle (a circle that passes through each of the vertices of a polygon) forming a triangle and defining a plane. Each of these triangular planes shares an edge with another, and a continuous surface is made. This methodology is typically referred to as a triangulated irregular network (TIN). On the basis of Delaunay triangulation, this means that for any given (x,y) point, there can be only one unique z value within the surface [Golden Software, 2012].
3DField
3DField is a contouring surface plotting and 3D data program that runs under Microsoft Windows NT/XP/Vista/7. 3DField converts the data into contour maps and surface plots. It creates a 3D map or a contour chart from the scattered points, numerical arrays or other data set. All aspects of 2D or 3D maps can be customized to produce the exact presentation desired [Galouchko, 2012].
Other contour map software
Other Contour Map Software includes: Garmin Basemap, mapviewer, Contour storyteller, Function Grapher, Auto plotter, Visual data, Filter test, AutoDEM Li Contour and several other software are available for production of contour map. Any of these software can also be used for the production of Contour map of the study area.
Scope and limitations of the study
The research covers the data acquisition, processing and presentation and comparison of the final product. All these were carried out in Yanbu Industrial City while the following are the limitations of this research:
1. The work is only carried out in Yanbu Industrial City.
2. Automatic level was used to obtain orthometric height as against the use of digital or geodetic level.
The study area
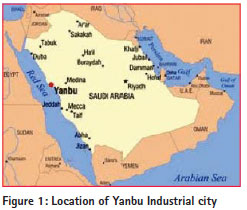
The study was carried out in Yanbu Industrial City (popularly known as ‘Yanbu Al-Sina’iya’ in Arabic which literarily means Industrial Yanbu) in Madina Province of Saudi Arabia. The city was established around 1975, located on the Coast of Red Sea about 350 km North of Jeddah. With latitude 23059’57.840″N (23.9994) and longitude 38013’39.000″E (38.2275) Yanbu Industrial City has a section called the Royal Commission (RC). Its residents are mostly expatriates mostly from Europe, America and other western countries. RC Yanbu Existing Area is about 185 km² and the expansion area is about 420 km². The industrial developed land is estimated to be 3,240 Hectares [10]. The presence of industries such as the oil refineries, plastics facility and several other petrochemical plants in the existing and expansion of Yanbu Industrial City will require detailed map and updating of the existing map of which contours have a prominent role to play. Contour maps will also enhance monitoring of the existing structures. Therefore, a quick and fast method such the use of ‘Satlevel’ collocation model will minimise the rigour of data collection of the existing method.

Aims and objectives
The aim of this work is to produce contour map of the study area from data generated using conventional levelling and ‘Satlevel’ Collocation Model. The objectives are:
1. To acquire data for ellipsoidal and orthometric heights of the study area.
2. To compute geoidal coefficients of the ‘Satlevel’ Collocation Model in the study area using least squares adjustment.
3. To generate data for production of contour map.
4. To plot the contour map of the study area using AutoCAD Civil 3D software.
Methodology
Materials and data
The equipment needed for the exercise are:
• GNSS receiver and its accessories to acquire data for ellipsoidal height;
• Digital Level and its accessories to acquire data for orthometric height;
• Computer and its accessories for computation and analysis;
• AutoCAD Civil 3D software for plotting the contour; and
• Any software or program that can implement least square adjustment.
In this exercise Microsoft Office Excel was used for all computations. ‘Orthometric Height on Fly’ [7] was used to validate the results.
‘Satlevel’ collocation model
Detailed explanation of the derivation and assumption of ‘Satlevel’ Collocation model can be seen in [Olaleye et al, 2011]. The model is of the form:

(Aleem, 2013)
Where:
NL is the long wavelength part of the geoid undulation in the area.
A1, A2 and A3 are the geoidal coefficients which are unknown coefficients to be determined.
Φand n are the WGS 84 geodetic coordinates (latitudes and longitudes)
ri is residue at an observation point.
The ‘Satlevel’ Collocation model geoidal coefficients of the area were computed using least squares adjustment observation equation method.
Data acquisition
Levelling operation was carried out to obtain data for orthometric height. GNSS observation was carried out to acquire data for geodetic coordinates which includes the geodetic latitude, geodetic longitude and ellipsoidal height. Other relevant data such as constant for the referenced ellipsoid were collected from various literature and INTERNET websites for data analysis and processing.

Data processing
Levelling reduction was done; the reduced levels were the orthometric height of each of the points. GNSS observation was processed to get the three dimensional coordinates. These are the geodetic latitude (Φ), geodetic longitude (n) and ellipsoidal height (h), which were used in ‘Satevel’ Collocation model.

The ‘Satlevel’ Collocation model geoidal coefficients were computed and used to obtain the geoidal undulation of each point in the area, which were connected to get the geoidal surface.
The geoidal undulations and ellipsoidal heights obtained from the result of GPS observations were used in Equation 1 to get the orthometric height of each of the points in the study area.
The orthometric heights generated from ‘Satlevel’ Collocation and the geodetic coordinates of the area were plotted into contour map using AutoCAD Civil 3D software (Figure 5).
The orthometric heights acquired using geodetic levelling method and the geodetic coordinates of the area were also plotted onto the contour map using AutoCAD Civil 3D software (Figure 6).
The following procedure was used in producing contour maps in Auto CAD Civil 3D 2013:
– The data was imported as text file as CSV (Comma delimited) to create the points of the surface.
– The surface was created by a Triangulated Irregular Network (TIN) method with 1m interval.
– The major contours lines were labelled.
Results and discussions
Results
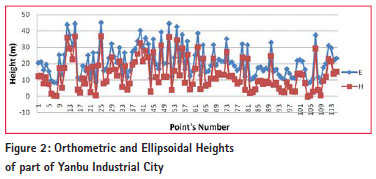
Some of the data used for this research acquired in Yanbu Industrial City were randomly selected and used to plot chart (Figure 2):
The values of the geoidal coefficients computed using least square adjustment observation equation as:
NL=7.85995128; A1=0.36447485; A2=- 0.5309024; A3=0.15167311
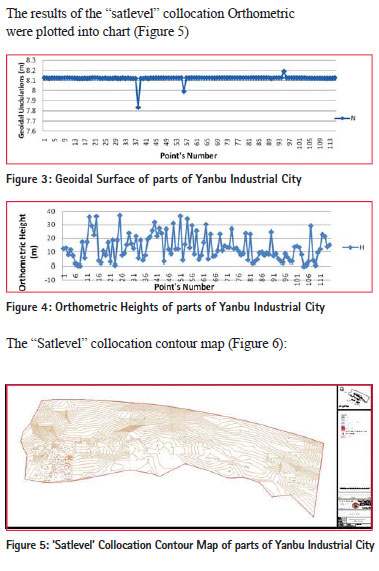
The results of the ‘Satlevel’ Collocation geoidal undulations were plotted into chart (Figure 3):

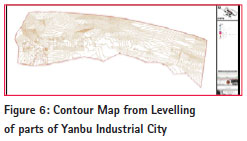
The result of the “satlevel” collocation orthometric height were plotted into chart (Figure 5):
Discussion
In the chart shown in Figure 2, ellipsoidal and orthometric height that follows the same pattern is an indication that the two are true representation of the same terrain.
Figure 4 shows the geoidal surface of Yanbu Industrial City. In this chart, the geoidal undulations of 3 of the points were outrageous, which is an indication that there was presence of outliers in the observations. These observations should have been removed because they are more than 3 standard deviations [Heliani et al, 2004]. This might have created an impact on the map shown in Figure 6. When the outliers were removed, the chart produced a continuous and smooth surface. This is an indication that ‘Satlevel’ Collocation like any other analyses required removal of outliers from the observation.
Conclusion and recommendation
Conclusion
In this study, levelled heights were established along with GPS observation in some parts of Yanbu Industrial city to model the geoid in the study area. We have coordinated some of the points collocated with both GNSS and levelling in the area. ‘Satlevel’ Collocation Model was used to get the geoidal coefficients, which were used to get the geoidal undulation for each of the points. Ellipsoidal heights from GNSS observation were used to get the orthometric heights, and used to plot the contour with AutoCAD Civil 3D software. Orthometric height information was also used to plot another map using the same AutoCAD Civil 3D software. The map was compared with the acquired data.
Recommendations
The area of coverage needs to be extended and more data should be acquired to improve the results.
Contracts for the production of maps should be awarded to the Institutions of Higher learning in the Kingdom. This will enable the participating staff to acquire more experience, so as to improve the qualities of graduates for future challenges. A local geoid model for Saudi Arabia is hereby recommended to commence.
References
Aleem, K. F, GPS and Remote Sensing of Environment, The Graduate Surveyors, Journal of NISS University of Nigeria, Enugu Campus. 12(1) 24 – 29, 1996
Aleem, K. F., Drafting and Mapping (GET 102). Lecture Notes. Department of Geomatics Engineering Technologies, Yanbu Industrial College, Kingdom of Saudi Arabia. UNPUBLISHED. 2011.
Aleem, K. F. “Adaptation of a Global Orthometric to a Local Height Datum Using “Satlevel” Collocation Model”. A Ph.D Thesis. Department of Surveying and Geoinformatics, University of Lagos Nigeria,. UNPUBLISHED 2013.
Aleem, K. F. (2013) Satlevel Collocation Model for Production of Contour Map of Yanbu Industrial City, Saudi Arabia. Journal of Emerging Trends in Engineering and Applied Science. (JETEAS) 4(2): 156-161 April 2013. http://jeteas.scholarlinkresearch. org/articles/Satlevel%20Collocation%20 Model%20for%20Production.pdf
Aleem, K. F., J. B. Olaleye, O. T. Badejo and J. O. Olusina, A Combination of Ellipsoidal Height from Satellite Method and Orthometric Height for Geoid Modelling, publication of the International Global Navigation Satellites Society IGNSS website, . http://ignss.org/Conferences/PastP apers/2011ConferencePastPapers/2011PeerR eviewedPapers/tabid/108/Default.aspx2011
Baris Uz, MOMRA Mapping Reference Framework. Geo tech Briefly. GeoTech Quarterly Volume 1 Issue 1 http://www. ags-group.com/gq/v1i1/?f=Z2VvdGV jaGJyaWVmbHlhLnBocA== 2012
Boehlke J., What Do Topographic Maps Show?, Online Article accessed on the 12th November, 2012
http://www.ehow.com/about_4614538_ what-do-topographic-maps-show.html, 2012
Galouchko V., Contour Map Software 3DField, Accessed on 31st of December 2012. http://field.hypermart.net/2012.
Golden Software, Inc., “AutoCAD Civil 3D 11: Powerful Contouring, Gridding, and 3D Surface Mapping Software for Scientists and Engineers”. Online Article 12 November 2012 http://www. goldensoftware.com/products/AutoCAD Civil 3D/AutoCAD Civil 3D.shtml,2012.
Heliani, L. S., Y. Fukuda, and S. Takemoto. Simulation of the Indonesian land gravity data using a digital terrain model data. Earth Planets Space, 56(1): 15–24, 2004.
Olaleye, J. B., K. F. Aleem, J. O. Olusina and O. E. Abiodun, Establishment of an empirical geoid model for a small geographic area: A case study of Port Harcourt, Nigeria, Surveying and Land Information Science. 70(1): 39- 48(10) http://www.ingentaconnect. com/content/nsps/salis/2010/ 00000070/00000001/art00006 , 2010.
Perry-Castañeda Library (PCL), Map Collection. University of Texas. Available online. Accessed on 22nd of December, 2012 . http://www.lib. utexas.edu/maps/saudi_arabia.html
Royal Commission for Jubail and Yanbu (RCJY), Royal Commission at Yanbu, Annual Report of the Strategic Planning & Investment Development Division Economic Planning Department. Accessed on 20th January, 2012. https://eservices.rcyanbu.gov.sa/Doc/ YanbuIndustrialCityEconomicReview. pdf, 2012.
Williams N. A.. What Does a Contour Map Show?, | eHow.com Online Article accessed on the 12th October, 2012,


 (9 votes, average: 2.33 out of 5)


Leave your response!