Active RFID trilateration for indoor positioning
| Guenther Retscher and Qing Fu |

unknowns (where n must be > p + 1). The possible order p of the polynomial function depends on the number of available signal strength observations n and the desired level of approximation.
From previously conducted tests (see Retscher and Fu, 2007a) it could be seen that the mean of the residuals is larger using the logarithmic model than for the simple polynomial fit for the signal strength to distance conversion in trilateration. For this reason, the simple polynomial model provides a more accurate fit to the distance data as the logarithmic model.
If several RFID tags are located in thesurrounding environment the current position of the RFID reader can be obtained using trilateration. Then the deduced distances to at least three RFID tags are needed to calculate a 2-D position fix with intersection and an unknown scale factor which takes the difference between the deduced ranges to the RFID tags and the reference point system into account. If more than three distances are available, the position fix can be calculated using a least squares adjustment (see Retscher and Fu, 2008).
Field test setups and results

For testing our approach the path from a public transport stop (i.e., underground station ‘Karlsplatz’) to an University building was selected (see Figure 1). Three RFID tags were installed at the entrance of the underground station ‘Karlsplatz’ (indoor area). Along a road between the underground station and the university building (‘TU Vienna’ in Figure 1; outdoor area) seven tags were installed on buildings along the way. Additionally, three tags were installed at the building’s entrance (indoor area). Each circle indicates a different cell.
In the experiment cell-based positioning has been applied in outdoor areas as an alternative to GPS positioning. As the accuracy of cell-based positioning generally depends on the size of the distinguishable cells, the achievable positioning accuracies might not be sufficient for indoor areas. Ranges from the RFID tags location have been achieved up to around 20 m. In the indoor area mostly higher positioning accuracies are required. Therefore several RFID tags have been installed in the transition zones between outdoor to indoor to be able to locate the user with a higher precision.
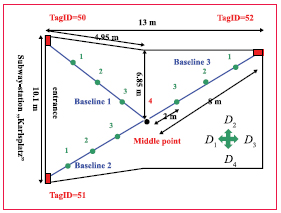
For a conversion of the measured signal strength into a range a so called calibration was carried out in the indoor environments in order to get the coefficients of the polynomial model described in equation (5). Figure 2 shows the installation of the tags in the entrance of the underground station ‘Karlsplatz’ as an example. For the conversion of the signal strength into a range a calibration along three baselines from the RFID tags has been performed to obtain calibration parameters of a characteristic curve for each line.

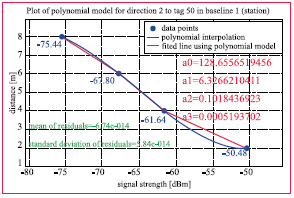
Figure 3 shows the polynomial model approximation with an order of p = 3 and their resulting coefficients for one of the three baselines in the underground station ‘Karlsplatz’. For each baseline different coefficients are obtained, because the signal strengths of different tags were influenced differently by the objects in their surroundings. The mean values of the residuals of all the polynomial approximations are nearly zero and their standard deviations are also almost zero. This means that a good approximation with the used polynomial model is achieved. The trend of the polynomial fit is very similar. The measurements have been performed at night with no people walking around.
Two sorts of test were carried out in total. In the first test the signal strength measurements were performed static over a time span of around one minute on the same points used in the calibration, since we know the true location of these points. In the second test the user was walking continuously inside the test area either from the entrance to the center of the test area or vice versa.
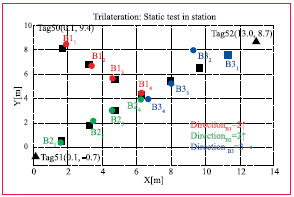
The positioning results of the static test for the entrance of the underground station ‘Karlsplatz’ are shown in Figure 4. Table 1 shows the deviations in the X- and Y-coordinates (dX and dY) from their true location and the radial deviation dr for all test points. In average the radial deviation is only 0.32 m with a standard deviation of ± 0.40 m. The maximum deviation of one point was 0.34 m in the X-coordinates and -1.44 m in the Y-coordinates. This pointcan be considered as an outlier as the deviations of the other points are much smaller.w
In the second kinematic test the reader was carried from the middle of the entrance of the underground station ‘Karlsplatz’ to the middle of tag 50 and 51 (from right to left in Figure 2) over a distance of around 14 m. Unlike the measurements in the first test, in this test every point was measured only for a few seconds. Figures 5 shows the positioning results. It can be seen that the trend of the trajectory can be correctly determined. The positioning accuracy was in the range of ± 2 to 3 m. |
|
«Previous 1 2 3View All| Next»
Pages: 1 2 3


 (5.00 out of 5)


 (5.00 out of 5)


 (5.00 out of 5)


 (4.99 out of 5)
Leave your response!