| LBS | |
Acquisition sensitivity limits of new civil GNSS signals
|
||||
| Location based services (LBS) are a rapidly growing field of wireless data services that can be accessed through a mobile phone equipped with a GNSS receiver. Some of the services are intended for outdoor use while others are suited for use in urban and indoor areas. It is therefore likely that subscribers will expect these services to be available throughout the coverage area of the mobile telephone network. Regulators, who are mainly interested in the positioning of emergency calls, have likewise established requirements for mobile phones that have a builtin GNSS receiver. According to the requirements, the GNSS receiver must successfully acquire and track satellite signals under measurement scenarios that simulate heavy signal attenuation. Since the processing load for signal acquisition has a strong inverse dependency on signal power, acquisition is rapidly becoming the most demanding task computationally of modern consumer GNSS receivers.
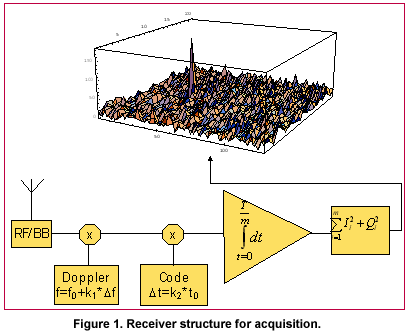
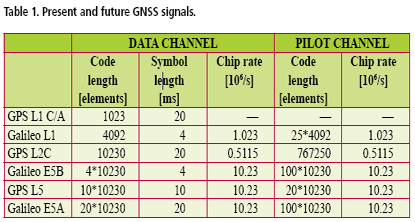
The challenge of signal acquisition does not depend only on the received signal power but also on the availability of reference time, reference frequency, satellite ephemeris information, and an initial location estimate. When available, they allow the receiver to calculate estimates for Doppler shifts and, if sufficiently accurate, for code phases. The estimates allow the receiver to reduce search ambiguity and the time and effort needed for acquisition. The reference time and reference frequency could, in principle, be obtained from a good crystal oscillator. However, the crystal oscillator of a consumer grade receiver is often prone to temperature drift and other instabilities. GNSS receivers that are integrated into a mobile phone have a high-quality frequency reference available from the cellular network. If the so-called assisted GNSS (A-GNSS) functionality is enabled, the receiver can also obtain time, location and satellite ephemeris information from the network. The required transactions are specified in all mobile telephone standards but the functionality has not, unfortunately, been implemented in all networks. The accuracy and content of the information is also dependent on the network. Trends in receiver architectureTo successfully search and detect a GNSS satellite signal in an area of heavy fading it is often necessary to use an integration time of one second or more. This is true in particular when oscillator instability, signal modulation or receiver movement limits coherent integration time. Under such circumstances, a serial search would proceed extremely slowly except when accurate prior information about the code phases and Doppler frequencies is available. Modern consumer GNSS receivers are therefore more and more often equipped with a means of efficient parallel acquisition. A typical acquisition processor consists of a bank of time-domain matched filters for code phase searching and a digital Fourier transformer for frequency searching. A recent trend is to use softwarebased acquisition and to perform the matched filtering in the frequency domain, which is computationally efficient. This kind of software acquisition is typically carried out off-line and the required transforms between the time and frequency domain are performed with FFT. The processing of a delay-frequency bin for satellite acquisition is conceptually shown in Fig. 1. A stream of complex-valued baseband samples from the receiver RF section is multiplied with a locally generated replica signal to eliminate – or wipe off – the Doppler frequency and ranging code, leaving a complexvalued DC signal. The DC signal is then integrated coherently, squared, and added to a memory location dedicated to the specific combination of Doppler frequency and code delay. This sequence of operations, which constitutes one non-coherent processing step, is performed for each delayfrequency bin in parallel and repeated one or several times. Finally, a decision strategy is applied to the contents of the memory and a conclusion made about the existence of a satellite signal in one of the bins. If there is a known data modulation on the signal, it can also be wiped off. The wipe-off operations are linear so that their order of execution can be freely changed without effecting the end result, which is useful when optimising the HW implementation. Practical considerations, such as the availability of special signal processing elements, have resulted in widely different implementation architectures. Numerous studies have been published about sequential acquisition strategies where the same hardware is allocated on different search bins at different times. An element frequently present in sequential strategies is multiple dwelling, where some bins are processed repeatedly to verify the acquisition results. Sequential strategies implicitly assume that acquisition performance is limited by the processing capacity. However, the rapid evolution of digital hardware is making the assumption less relevant. In fact, commercial receivers already contain real-time acquisition processors that can handle tens of thousands of delay-frequency bins in parallel, and SW receivers operating off-line with sample streams stored in memory do not even have strict hardware limitations. It is therefore interesting to know how acquisition performance is bounded when processing restrictions are removed and only physical limitations apply. It turns out that acquisition sensitivity then becomes heavily dependent on the length of the ranging code and on the availability of assistance information, a fact that has not been fully appreciated in the GNSS literature. New civil GNSS signals and their acquisition strategiesThe short C/A code was dedicated for acquisition and the longer P(Y) code for tracking in the original GPS specification. There is no similar division in the newer L1C [IS-GPS- 800], L2C [Fontana] and L5 [ISGPS- 705] civil signal specifications or in the Galileo OS [GJU] signal specification. Instead, all component signals have fairly long ranging codes and some of them also have high bit rates. These characteristics are likely to make acquisition difficult due to the resulting expansion of the search space and reduction of bit energy. The new specifications also include pilot signals that take up a significant fraction of the transmitted power. While it is thinkable that the unmodulated pilots are useful for tracking, it is questionable whether they can be used in acquisition due to their extremely long cycle lengths. Table 1. shows the code lengths and other parameters of some present and future civil GNSS signals. The shortest ranging code belongs to the GPS L1 C/A signal and the longest to the GPS L2C pilot signal, the difference being approximately three orders of magnitude. Both codes are shift-register generated sequences that do not have a discernible substructure. As another example, the proposed Galileo L1 OS pilot signal has a concatenated ranging code consisting of a primary code with 4092 elements and a secondary code with 25 elements. Its cycle length is the product of the lengths of the component codes, i.e. 102300 elements. The size of the acquisition search space is the product of four factors: the code length of the ranging code, the number of frequency search bands, the time domain over-sampling ratio, and the frequency domain over-sampling ratio. The number of frequency search bands is proportional to the coherent integration time since the latter is inversely related to the receiver bandwidth. In order to avoid code self-noise, the coherent integration time should normally be an integer multiple of code cycles. In the case of the GPS L2C pilot signal, this means that the shortest possible coherent integration time is 1.5 seconds. The coherent integration time for the GPS C/A signal is limited by data modulation to about 20 ms. It follows that the number of frequency search bands needed for the GPS L2C pilot signal is about 100 times larger than that needed for the GPS C/A signal, and further, that the size of the search space for the GPS L2C pilot signal exceeds that for the GPS L1 C/A signal by five orders of magnitude. |
||||
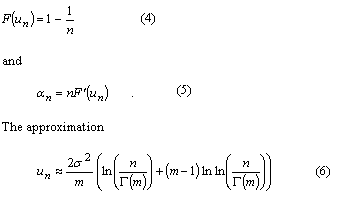
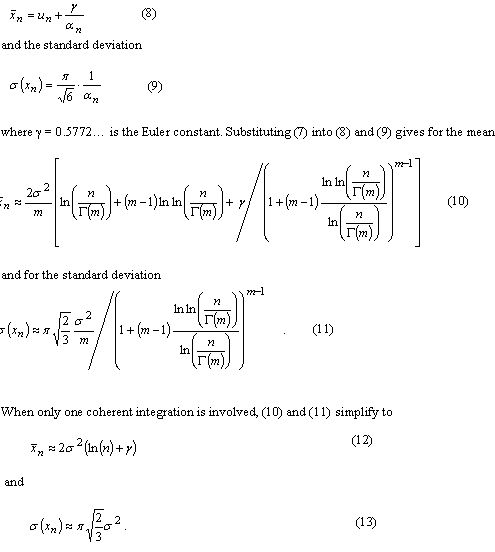
Theoretical and practical limitationsA useful insight into parallel acquisition can be gained by examining the statistics of noise bins in the search space. It is well known that the squaring and subsequent summing of m independent complex zero-mean Gaussian variables results in a central chi-square distributed variable with 2m degrees of freedom [Proakis]. This is exactly the process that produces the noise bin values when there are m coherent integrations and when the input is thermal noise. Assuming a constant total reception time and an input power that corresponds to a noise variance equal to s2 at both integrator outputs when m is one, the cdf of a noise bin for an arbitrary m is The related mean value of the distribution is Extreme value theory (EVT), a branch of mathematics developed by Fisher, Tippett, Gumbel and others during the 20th century, proves that the limiting distribution Fn of the maximum of n i.i.d. random variables, when n tends to infinity, has one of three possible functional forms depending on the tail of the parent distribution. For the chi-square distribution and other distributions with an exponentially decreasing tail, the limiting distribution has the double exponential form for the chi-square distribution can be obtained from an expression given by Gumbel [Gumbel] for the gamma distribution. Numerical evaluation shows that the approximation is fairly accurate for values of m up to five or six. Substituting (6) and (1) into (5) gives The double exponential distribution (3) has the mean value It can be seen from (10), (11), (12) and (13) that the mean of the maximum of the chi-square distributed noise bins has a logarithmic or slightly stronger than logarithmic dependency on the size of the search space, while the standard deviation of the maximum is nearly constant. In other words, the graph of the probability density function of the noise maximum maintains its width but is shifted horizontally when n changes. This means that signal detection thresholds also have to be shifted in order for error probabilities to remain constant. The consequence of this is that the receiver acquisition sensitivity is lower when the size of the signal search space is larger, the required signal power being approximately proportional to the logarithm of the size of the space. In an earlier contribution [Turunen] the author derived an expression for the false acquisition probability in a scenario where a satellite signal is known to be present and the receiver simply chooses the highest peak in the search space. With the noise power assumption made above and with a signal power such that the squarer output is equal to E when m is one, the false acquisition probability for an arbitrary m was found to be is the pdf of the non-central chi-square distribution obeyed by the signal bin. The last term in (15) is the modified Bessel function of the first kind of order m-1. Substituting (1) and (15) into (14) and making the substitution is the incomplete gamma function. |
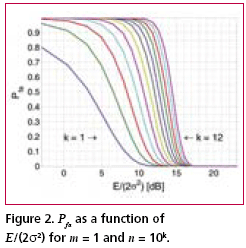
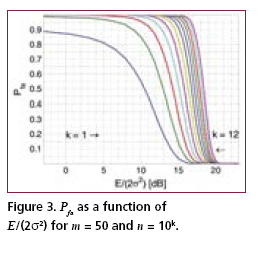
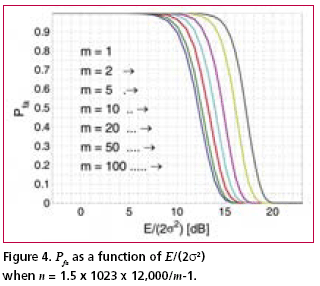
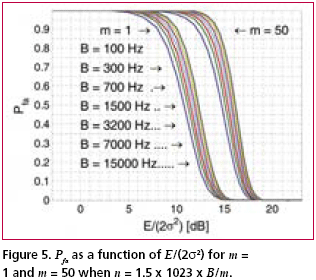
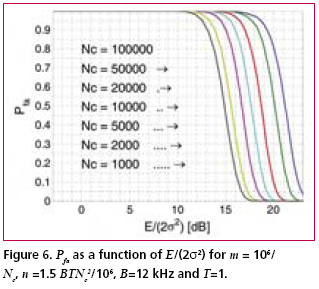
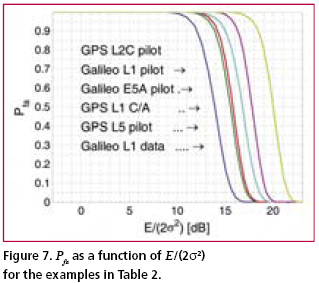
Numerical examplesFig. 2 shows the probability of false acquisition from (16) as a function of E/(2s2) for several values of n when m = 1. Due to the identity E/(2s2) = PT/(FN0 ), (18) where P is the signal power at baseband input, T is the total reception time and F is the noise figure, E/(2s2>) can be interpreted as the ratio of signal power to noise spectral density at the receiver base-band input when T is one second. Fig. 3 is otherwise similar except that m = 50. It can be seen from the figures that when either m or n varies within the chosen limits, the sensitivity changes by approximately five decibels. The width of a frequency search band is approximately two thirds of the inverse of the coherent integration time [Kaplan], such that the number of frequency bands is where B is the total frequency search range. The size of the search space, which includes the n noise bins and the one signal bin, is the product of Nf and the length of the ranging code when no oversampling is assumed. Due to (19), n and m are therefore inversely related. Fig. 4 shows the Pfa plots for seven pairs of m and n that exhibit this relationship. It is assumed that T is one second, B is 12 kHz and the code length is 1,023 elements. The figure shows that the net effect of increasing the number of coherent integrations is a reduction in sensitivity. Fig. 5 illustrates the effect of frequency uncertainty on the false acquisition rate when (19) applies. There are two groups of curves, one for m = 1 and another for m = 50, and seven frequency search ranges from 100 Hz to 15000 Hz. The code space uncertainty is 1,023 and T is one second. It may be observed that the sensitivity impact of changing the number of coherent integrations is about 4 dB and that of varying the frequency search range about 2 dB. Fig. 6 shows how sensitivity depends on the code length Nc in an example where the coherent integration length is equal to Nc code elements and the total reception time is a fixed number of code elements, 106 in this case. Taking (19) into account it follows that n = 1.5 BTNc2/106. It is further assumed that there is no oversampling, B is 12 kHz and T is one second. The figure shows that sensitivity becomes higher when the code length is increased. This happens regardless of a simultaneous expansion in the search space. Finally, Fig. 7 shows six Pfa plots that are motivated by six existing or proposed GNSS signals. The signals with some of their parameters are listed in Table 2. The number of delay search phases is based on the assumption of taking one sample per code element. For the GPS L2C pilot signal, the correct figure is twice the number of code elements since the signal is timemultiplexed with a data signal. For the Galileo L1 pilot signal, the number of delay search phases is the product of the lengths of a BOC (biphase) code, a primary ranging code, and a secondary ranging code. For all signals, the frequency uncertainty bandwidth B is assumed to be 12 kHz. The reception time T is chosen to be 1.5 seconds according to the coherence time of the GPS L2C signal which is the longest in the table. The number of coherent integrations was obtained from assuming that the coherent integration time is equal to the coherence time of the signal. The number of frequency search bands is calculated from (19). Based on the plotted results, the attenuation margin corresponding to a Pfa of 10% and a noise figure of 4 dB is shown in the rightmost column of the table. The margin was calculated by subtracting the required power obtained by solving P from (18) from the nominal signal power. Shown in the table is also the post-detection S/ N ratio, defined here as the difference of the mean value of the signal bin, 2s2+E/m, and the mean value of a noise bin, 2s2, divided by the latter. As seen from Table 2, the required value of E/(2s2) is higher when the number of coherent integrations is larger. This is obviously due to the fact that the length of the coherent integration period is inversely proportional to the number of integrations, which leads to a lower post-detection S/N ratio when the number is larger. The fact that the reduction in the post-detection S/N ratio is not refl ected as a higher false acquisition rate would suggest that the simultaneous reduction in the size of the search space has a compensating effect. It should be kept in mind, however, that the post-detection S/N ratios do not fully characterize the signal distributions in the search space. ConclusionThe importance of sensitivity for consumer GNSS receivers was discussed in view of location based services and emergency call positioning. The dependence of acquisition sensitivity on the size of signal search space was discussed in the context of an ideal parallel acquisition receiver. The discussion was motivated by the fact that parallel acquisition is gaining popularity in commercial receivers due to growing performance requirements and due to improvements in signal processing electronics. To characterize noise distributions in very large search spaces, results from extreme value statistics (EVT) were used to show, among other things, that the mean of the noise maximum is approximately proportional to the logarithm of the size of the search space. An analytic expression from an earlier publication was used to plot false acquisition probabilities for acquisition scenarios with different numbers of coherent integration steps and frequency search bands. The expression was also applied to analyse the acquisition properties of the chosen GPS and Galileo signals. The results indicate that the best achievable acquisition sensitivity depends not only on signal power and coherence time but also to a signifi cant extent on the size of the search space. ReferencesIS-GPS-800, Navstar GPS Space Segment / User Segment L1C Interfaces, GPS Navstar JPO, 19. April 2006. . R.D. Fontana, W. Cheung, P.M. Novak, and T.A. Stansell, Jr., “The new L2 civil signal,” ION GPS 2001, pp. 617-631, 11-14 September 2001. . IS-GPS-705, Navstar GPS Space Segment / User Segment L5 Interfaces, GPS Navstar JPO, 5. January 2005. . L1 band part of Galileo Signal in Space ICD, http://www. galileoju.com, Galileo Joint Undertaking (GJU), 2005. . J.G. Proakis, Digital Communications. McGraw-Hill, 1995. . E.J. Gumbel: Statistics of extremes.375pp. Dover publications, 2004. • S. Turunen, “Combinatorial loss in satellite acquisition,” ION GNSS 2005, Long Beach, CA, USA, 13–16 September 2005. • E.D. Kaplan (ed.), Understanding GPS principles and applications, Artech House Publishers, 1996. |
||||||||||||
|








 (No Ratings Yet)


