| LBS | |
Acquisition sensitivity limits of new civil GNSS signals
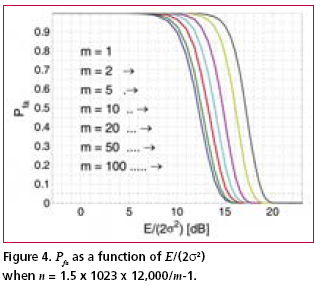
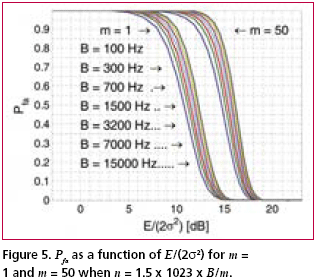
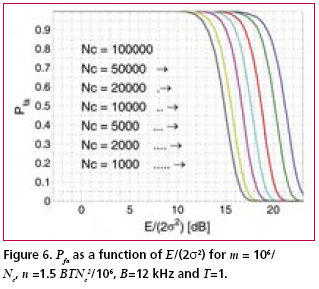
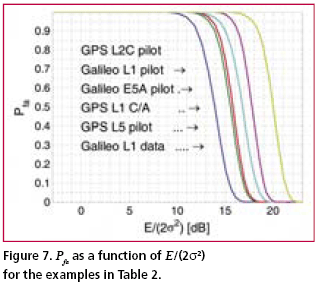
Numerical examplesFig. 2 shows the probability of false acquisition from (16) as a function of E/(2s2) for several values of n when m = 1. Due to the identity E/(2s2) = PT/(FN0 ), (18) where P is the signal power at baseband input, T is the total reception time and F is the noise figure, E/(2s2>) can be interpreted as the ratio of signal power to noise spectral density at the receiver base-band input when T is one second. Fig. 3 is otherwise similar except that m = 50. It can be seen from the figures that when either m or n varies within the chosen limits, the sensitivity changes by approximately five decibels. The width of a frequency search band is approximately two thirds of the inverse of the coherent integration time [Kaplan], such that the number of frequency bands is where B is the total frequency search range. The size of the search space, which includes the n noise bins and the one signal bin, is the product of Nf and the length of the ranging code when no oversampling is assumed. Due to (19), n and m are therefore inversely related. Fig. 4 shows the Pfa plots for seven pairs of m and n that exhibit this relationship. It is assumed that T is one second, B is 12 kHz and the code length is 1,023 elements. The figure shows that the net effect of increasing the number of coherent integrations is a reduction in sensitivity. Fig. 5 illustrates the effect of frequency uncertainty on the false acquisition rate when (19) applies. There are two groups of curves, one for m = 1 and another for m = 50, and seven frequency search ranges from 100 Hz to 15000 Hz. The code space uncertainty is 1,023 and T is one second. It may be observed that the sensitivity impact of changing the number of coherent integrations is about 4 dB and that of varying the frequency search range about 2 dB. Fig. 6 shows how sensitivity depends on the code length Nc in an example where the coherent integration length is equal to Nc code elements and the total reception time is a fixed number of code elements, 106 in this case. Taking (19) into account it follows that n = 1.5 BTNc2/106. It is further assumed that there is no oversampling, B is 12 kHz and T is one second. The figure shows that sensitivity becomes higher when the code length is increased. This happens regardless of a simultaneous expansion in the search space. Finally, Fig. 7 shows six Pfa plots that are motivated by six existing or proposed GNSS signals. The signals with some of their parameters are listed in Table 2. The number of delay search phases is based on the assumption of taking one sample per code element. For the GPS L2C pilot signal, the correct figure is twice the number of code elements since the signal is timemultiplexed with a data signal. For the Galileo L1 pilot signal, the number of delay search phases is the product of the lengths of a BOC (biphase) code, a primary ranging code, and a secondary ranging code. For all signals, the frequency uncertainty bandwidth B is assumed to be 12 kHz. The reception time T is chosen to be 1.5 seconds according to the coherence time of the GPS L2C signal which is the longest in the table. The number of coherent integrations was obtained from assuming that the coherent integration time is equal to the coherence time of the signal. The number of frequency search bands is calculated from (19). Based on the plotted results, the attenuation margin corresponding to a Pfa of 10% and a noise figure of 4 dB is shown in the rightmost column of the table. The margin was calculated by subtracting the required power obtained by solving P from (18) from the nominal signal power. Shown in the table is also the post-detection S/ N ratio, defined here as the difference of the mean value of the signal bin, 2s2+E/m, and the mean value of a noise bin, 2s2, divided by the latter. As seen from Table 2, the required value of E/(2s2) is higher when the number of coherent integrations is larger. This is obviously due to the fact that the length of the coherent integration period is inversely proportional to the number of integrations, which leads to a lower post-detection S/N ratio when the number is larger. The fact that the reduction in the post-detection S/N ratio is not refl ected as a higher false acquisition rate would suggest that the simultaneous reduction in the size of the search space has a compensating effect. It should be kept in mind, however, that the post-detection S/N ratios do not fully characterize the signal distributions in the search space. ConclusionThe importance of sensitivity for consumer GNSS receivers was discussed in view of location based services and emergency call positioning. The dependence of acquisition sensitivity on the size of signal search space was discussed in the context of an ideal parallel acquisition receiver. The discussion was motivated by the fact that parallel acquisition is gaining popularity in commercial receivers due to growing performance requirements and due to improvements in signal processing electronics. To characterize noise distributions in very large search spaces, results from extreme value statistics (EVT) were used to show, among other things, that the mean of the noise maximum is approximately proportional to the logarithm of the size of the search space. An analytic expression from an earlier publication was used to plot false acquisition probabilities for acquisition scenarios with different numbers of coherent integration steps and frequency search bands. The expression was also applied to analyse the acquisition properties of the chosen GPS and Galileo signals. The results indicate that the best achievable acquisition sensitivity depends not only on signal power and coherence time but also to a signifi cant extent on the size of the search space. ReferencesIS-GPS-800, Navstar GPS Space Segment / User Segment L1C Interfaces, GPS Navstar JPO, 19. April 2006. . R.D. Fontana, W. Cheung, P.M. Novak, and T.A. Stansell, Jr., “The new L2 civil signal,” ION GPS 2001, pp. 617-631, 11-14 September 2001. . IS-GPS-705, Navstar GPS Space Segment / User Segment L5 Interfaces, GPS Navstar JPO, 5. January 2005. . L1 band part of Galileo Signal in Space ICD, http://www. galileoju.com, Galileo Joint Undertaking (GJU), 2005. . J.G. Proakis, Digital Communications. McGraw-Hill, 1995. . E.J. Gumbel: Statistics of extremes.375pp. Dover publications, 2004. • S. Turunen, “Combinatorial loss in satellite acquisition,” ION GNSS 2005, Long Beach, CA, USA, 13–16 September 2005. • E.D. Kaplan (ed.), Understanding GPS principles and applications, Artech House Publishers, 1996. |
||||||||||||
|




 (No Ratings Yet)