| Surveying | |
Survey requirements for river flood assessment and spatial planning
Experiences from river hydrographic measurements and LIDAR surveys in the Philippines |
 |
|
|
 |
|
Rivers are important sources of fresh and flowing inland water vital to the socio-economic functioning of society mainly for agricultural and urban service applications. Measurement and survey of river characteristics is therefore an indispensable exercise if any plans to develop, conserve and sustain resources found in river systems are to be drawn. In surveying, various methods for the measurement of geometric and hydrographic properties as well as the tenurial conditions of rivers have been established for different purposes ranging from power generation, water supply, irrigation and navigation. Surveys of rivers are also performed to serve as basis for planning, designing and implementing mitigation strategies to prevent, reduce or control riverine floods.
The Philippines River Systems and its Flooding Woes
In the Philippines, there are about 421 major river basins, 18 (>1,400 km2) of which are considered principal due to their economic value and social benefits they bring to the local communities. By international scales, the Philippine rivers are comparatively short due to the archipelagic configuration of the country. However, due to the vast and extensive use of river resources, citizens opt to live near rivers, streams and creeks.
Every year, the Philippines experiences devastating river-related disasters such as floods, rainfall-triggered landslides, debris flow and mudflows. According to World Risk Index 2012, the Philippines places third out of 173 countries ranked according to their “risk score” or their exposure to hazards such as floods and storms, drought and sea level rise (Muckle, 2012). Riverine floods are technically pure water hazards in contrast to landslides, debris flows and mudflows which carry with them solid materials such as sediments, boulders and trees.
In order to address the flooding problems, there is a need to gather information on river characteristics as critical inputs to the formulation of both structural and nonstructural measures to mitigate flooding hazards. It is necessary to incorporate the effect/influence of other development plans for an entire river system in the formulation of an overall flood control plan. For example, the height of levee will affect the design height of bridge. Likewise, the design riverbed profile will affect the design of the irrigation intake/canal and other related facilities.
The Philippine government undertook a massive effort to generate detailed elevation dataset and develop early flood warning for 18 major river systems throughout the country (Paringit et al, 2012). The Nationwide Disaster Risk and Exposure Assessment for Mitigation (DREAM) program employed airborne (Light Detection and Ranging) LIDAR technology to generate detailed topography of major river systems. Coupled with aerial surveys, ground surveys were also performed to capture parameters that cannot be obtained from airborne sensors.
River survey approaches for flood assessments
River surveys and investigation are typically conducted to generate the basic data and information necessary for the subsequent flood assessment and planning. From an infrastructure point of view, precise river surveys are conducted for the design and construction of appropriate river training structures and bank protection works. It is noted that the appropriateness of a particular plan/design rely much on the veracity and accuracy of available basic data and information. In addition to groundbased surveys, aerial photography has been traditionally used to generate topography, infer land uses and interpret geology.
We revisit the ground and aerial survey activities typically required for assessing river flooding conditions. These include control surveys, river cross-sections, profile surveys, bathymetry, hydrometric measurements and how aerial surveys, particularly with the use of airborne LIDAR, serve to supplant some of the spatial data requirements. We then present the methods we employed following the prescribed techniques and modification as the need arises. Lastly, we show the results and products of survey, processing and modeling exercise.
Ground Surveys
Control Surveys
The force of gravity, and hence water flow, depends on precise determination of elevation in and around rivers must be precisely known. Otherwise, backflows and wrong assessments of water dynamic behavior may occur.
Vertical control points or elevation benchmarks are typically established near river banks with the use of calibrated digital levels and observed Third Order Vertical Control (Type 2) standards: where distance D is given in kilometers). These control points were referred to the mean sea level (MSL) referenced from the nearest benchmark, initially established by the national mapping agency – the National Mapping and Resource Information Authority (NAMRIA). In the DREAM Program, the use of GNSS receivers was carried out in situations where a known control point was too distant from the survey site for a conventional leveling line to be established. Established horizontal control or reference points were also used as vertical control points provided proper connection through conventional or GNSS-based leveling is conducted.
River Cross-Section Surveys
For the development of master plans, river cross-sections at typical sites are done every 500 m to 1,000 m intervals along the stretches of a river of interest, depending on the size of the river from topographic maps (DPWH and JICAa, 2003, DPWH and JICAb, 2003). However, for implementation of typical river structure projects, finer scale surveys are conducted with horizontal scale of 1:500 to 1:2,000 depending on the size of the river. Vertical scales are of 1:100 to 1:500 depending on the topographic condition. Measurement of the interval between cross section survey ranges from 100 m to 1,000 m. The width of survey area is typically extended at least 20m beyond both banks, but may be further widened provided the location is still a flood prone area (e.g., based on best available flood hazard maps). The interval of measurement along the river-cross section ranges from 2m to 5m on narrow rivers and 5m to 20m for wide rivers.
For the case study presented here, GNSSbased kinematic-based techniques are employed to capture the river cross-section data in both upper and lower banks, and on both sides of the river. Traversing the river itself by wading through or riding a small boat or raft, the pole-mounted GNSS poles are carried by the survey or manually and an assistant to help clear out the section path. GNSS reading frequencies are set by distance moved, rather than by time interval. For shallow rivers, the surveyor has no choice but to wade through the river to cross the river channel.
River Profile Surveys
River profiles describe the longitudinal configuration of the river necessary to determine the slope/grade and configuration. The profile along the upper bank and lower bank on both sides of the river are typically generated to fully describe the channel geometry. Again, a GNSS-based kinematic mode survey technique was employed. A combination of GPS-depth meter with vertical and horizontal resolutions of 10cm and 100 meters, or finer, respectively were utilized in the river profile surveys. Ground control points were used for post-survey correction of survey tracks. Whenever possible, river profile surveys were done simultaneously with the cross section surveys to make use of the same reference and control point.
River Bathymetry Surveys
Echosounders equipped with GNSS receivers installed in a rubber boat or motorized banca are utilized for surveying the river bed profile of the main river channel. The combined echo sounder GNSS setup records the position and depth at half meter (0.5m) horizontal distance intervals with vertical (depth) precision of 10 cm with a time stamp (time of measurement) record for later synchronization with the GNSS-based position and time. Depth is measured from the echosounder transducer towards the bottom (river bed) surface less the draft length of the transducer. Two depth measurement passes are captured. The first is a sinusoidal path going from one side of the river to the other typically at a wave period of about 50m. The second is by running the sounderequipped boat along the thalweg – the deepest part of the river channel. Either way, the ability to follow the target path depends on the skill of the boat driver, the presence of obstructions and river current. Data from the two measurement paths are combined during the processing and adjusted for effect of tide.
Hydrometric Surveys and Monitoring
Inflows or incoming waters from the upper catchment area are measured for a continuous period in order to establish relationship of rainfall amount with flow in terms of magnitude and peak flow arrival time. Rain gauges are installed to measure rain intensity and time of occurrence in the catchment. For river water velocity, two instruments are used: the first is the typical propeller meter, while the other makes use of an Acoustic Doppler Current Profiler (ADCP). ADCP intended for river surveys, are typically designed to measure either horizontal or vertical profile of the flow.
Continuous measurement of depth of water at a fixed point is done by a datalogging pressure gauge or by recording the water level from an automated water level sensor (AWLS). Traditionally, water levels are manually read in a staff gauge strip painted or attached to the bridge pile/pier in the river. However, digital pressure gauges and AWLS have become popular alternatives due to reduced cost operation, reliability and safety. Data from the AWLS are transmitted to a server via a short message system (SMS) protocol over the mobile telephone network. The latter holds the distinct advantage of being valuable for real-time monitoring and decreases risk to personnel conducting the measurements during high-flows.
The cross-section of a river is measured where the velocity sensor/gauge is placed to compute for the flow across the section by trapezoidal method. Depending on the orientation of the ADCP, the velocities may vary horizontally or vertically and consequently the method to compute for the flow assumes that either the vertical or horizontal component of the velocity is held constant respectively.
Manual velocity measurements are conducted even without rainfall to establish base flows. During rainfall events however, the frequency of measurements are increased to 10-minute intervals in order to capture the rise of water as rainfall runoff comes down from the catchment. The AWLS measures the stage at 10-minute intervals.
Flow measurement records are used mainly for calibrating and validating the discharge models. Water level measurement obtained from the staff gauges or AWLS installed in the area of interest must also be tied to the MSL in order to establish the relative difference in elevation at different segments of the river. Applying a single reference system for the stage enables the observation and analysis of the cascading flood waters.
Aerial Surveys
Ground elevation is one of the most important datasets for conduct of flood modeling. For the case study presented in this project, LIDAR data at 2m points per m2 density was acquired in April 2013 through the DREAM Program (Paringit, et al, 2012). The LIDAR point clouds were then processed to produce 1m-resolution digital terrain model (DTM). The LIDAR dataset was post-processed to remove features captured by the LIDAR that may artificially impede flow of water along the river such as bridges during the flood simulation. The positional accuracy of LIDAR data was later evaluated using the cross section data gathered, as described in the previous section.
Since the topographic LIDAR system is not able to penetrate water and capture depth, the bathymetry of the river that was surveyed using the methods employed in the previous sections, was ‘burned’ into the LIDAR-derived DTM. This integration process also serves as one of the quality assessment procedures for ensuring that the LIDAR DTMs are properly calibrated. Uses of river survey data for flood modeling, mapping and monitoring
All the geometry data coming from different survey modes described above come together as input data for flood modeling. As was mentioned, the profile and cross section measurements are used to augment the river geometry along the river channel extracted from the LIDAR DTM data. This fused elevation data formed the basic geometric input of the flood model. Other datasets would be rainfall as the source of flooding and the tide measurement, if the downstream end of the river that was being modeled came from tide gauges or a predicted tide table. Surface roughness was obtained from the LIDAR measurements.
The river flood modeling program used in this paper is based on shallow water solution of the St Venant equation that simulates water flow along the river. Popinet (2003) implemented the shallow water equations using an adaptive mesh projection method for the time-dependent incompressible Euler equations. In order to take advantage of the availability of multicore computer processors, the computation domain may spatially discretized using quad/ octrees and a multilevel Poisson solver (Popinet 2012). Complex solid boundaries are represented using a volume-of-fluid approach. Second-order convergence in space and time is implemented on regular, statically and dynamically refined grids.
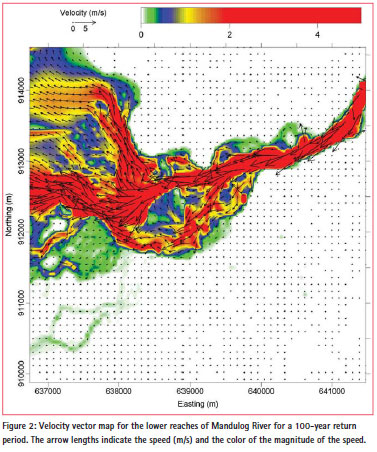
Aside from flood depths, the determination of speed of the rushing water is important for assessing flood hazards (Kelman and Spence, 2004). In this case, the depth-averaged velocity of the flooding is also captured during the simulation runs. The maximum velocity is assessed from the time series data.
Case studies
Iligan City River Flood Models and Maps
Our case study area, Iligan City in southern Philippines experienced 180mm of rainfall overnight, more than 60 percent of their average monthly rainfall pouring one event when Typhoon ‘Sendong’ (International Name: ‘Washi’) hit the country on the night of 17 December 2011. Gushing waters from the two rivers (Mandulog River and Iligan River) located in the city coincided with the high tide which restricted the flow of flood waters, the steep topography of the catchment, and the debris into the river exacerbated the impact of flash flood that contributed to the disaster. Deaths reached 492 with 90,285 persons affected, and economic losses amounted to $345 million (NDRRMC, 2011) for the entire area.
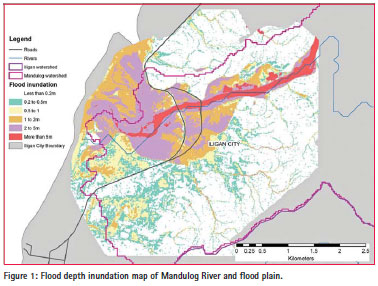
At total of 13 cross-section measurements were conducted. The bathymetry measurements, based on the surveys and LIDAR overflight data, high-resolution flood hazard map with 3D-rendition helps answer these questions. The map gave the spatial extent of flooding in the two rivers of Iligan City from rainfall that have 5-, 25-, 50- and 100-year rain return periods. It identifies in greater detail what communities will be affected at various flood depths since it could be plotted in a greater scale than what was previously available.
An example of a depth map is shown in Figure 1. The ranges (0.2m to 0.5m, 0.5 to 1.0m, 1 to 2m, 2m to 5m and >5m) were so selected so as to illustrate the possible physical impact of the inundation. The velocity map is shown in Figure 2.
The flood hazard maps basically defined the carrying capacity of the river. This is important in land use planning and zoning since it identifies decision zones where development and location of communities must be regulated. It also guides investment decisions such as what flood and drainage control facilities must be put in place, and how will they be designed to withstand future impacts of climate change. It also directs priorities for watershed management by influencing policies on managed production while protecting the upland areas. The flood inundation model which simulates the velocity of water flow will also guide the integrated flood monitoring and early warning system that the government intends to put in place.
By being able to pinpoint areas that are of highest risk to future flood events, local governments will be able to prioritize their programs and projects to address the vulnerability of communities therein, come up with better preparedness programs, and ensure the safety of all.
Final remarks
This paper discussed the different surveys employed in order to produce the data required to perform detailed flood hazard mapping and assessment. The flood hazard mapping exercise was able to define in greater detail the flooding susceptibility of the four river systems based on a combination of various survey techniques employed on ground and in air. The newly generated spatial information serves as a valuable input for land use planning and zoning since it identifies decision zones where settlement and development activities must be regulated. The flood scenarios also guides investment decisions such as what flood and drainage control facilities must be put in place, and how will they be designed to withstand future impacts of climate change. It will also guide priorities for watershed management by influencing policies on managed production while protecting the upland areas. The flood inundation model, which simulates the velocity of water flow, can guide the integrated flood monitoring and early warning system that government intends to put in place. By being able to pinpoint areas that are of highest risk to future flood events, local governments will be more equipped in prioritizing their programs and projects that will address the vulnerability of communities therein, come up with better preparedness programs, and ensure the safety of the citizens.
References
Department of Public Works and Highways (DPWH) and the Japan International Cooperation Agency (JICA) (2003), Manual on Flood Control and Planning, JICA, 135 pp.
Department of Public Works and Highways (DPWH) and the Japan International Cooperation Agency (JICA) (2003), Technical Standards and Guidelines for Planning and Design, 177 pp.
Kelman, I. and Spence, R. (2004), An overview of flood actions on buildings, Engineering Geology 73, 297–309.
Muckle, P. (2012), Disaster Risk, Environmental Degradation and Global Sustainability Policy, in World Risk Report 2012, Allied Development Works, pp. 5-10.
National Disaster Risk Reduction and Management Council (NDRRMC) (2011), Final Report on the Effects and Emergency Management Tropical Storm “SENDONG” (Washi), url: http://www.ndrrmc.gov.ph/attachments/ article/358/Final%20Report%20 re%20TS%20Sendong,%2015%20 -%2018%20December%202011. pdf; accessed: 18 December 2012.
Paringit, E. C. and Fabila, J. L. F. and SantillanJ. R. (2012), Highresolution digital elevation dataset derived from airborne lidar for flood hazard assessment and mapping applications. Proceedings of the 33rd Asian Conference on Remote Sensing (ACRS), Phuket, Thailand (in DVD).
Popinet, S. (2003), Gerris: a tree-based adaptive solver for the incompressible Euler equations in complex geometries, Journal of Computational Physics, 190(2), pp. 572-600.
Popinet, S. (2012) Adaptive modelling of long-distance wave propagation and fine-scale flooding during the Tohoku tsunami, Natural Hazards and Earth System Sciences, 12: 1213–1227.
Acknowledgements
The DREAM Program was supported by the Department of Science and Technology (DOST) Grant-in-Aid Program for the financial support to undertake this research program. The authors also thank the various agencies and local government units which made the surveys and measurements possible.
The paper was presented at FIG Congress 2014, Kuala Lumpur, Malaysia, 16-21 June 2014


 (4 votes, average: 2.50 out of 5)


Leave your response!