| GNSS | |
Phase centre determination on the basis of far-field measurements
This paper investigates the phase centre variations (pcvs) of a single antenna element as well as of a 2×2 array of such elements designed for gnss reception. |
|
Phase centre is defined as a point (or a set of points) in space from which, when emitted, far-field phase-fronts or, correspondingly, group-delay fronts are spherical or substantially spherical [1-2]. That is, the phase value is constant in a certain angular area of interest when measured with respect to the coordinate system whose origin is in the PC. However, PC is ambiguous for most of the real-life antennas and its position varies for different aspect angles, so it is rarely situated in the origin of the adopted coordinate system. In GNSS, the aspect angle of interest is usually around the direction of arrival (DOA) of the desired satellite signal.
GNSS antenna arrays introduce additional effects like mutual coupling, weighting factors and, due to adaptivity, a non-constant radiation pattern.
Description of the method
The phase contribution of displacement of the PC with respect to the coordinate system can be described by the scalar product of propagation and
where N is the number of sample points enclosed by the solid angle range.
Parameters of the antennas
The radiator is a right hand circularly polarised (RHCP) square patch antenna, designed for operation in L1 band (1.575 GHz) [4]. The antenna is fed through two slots in the ground plane, which are excited by microstrip lines.
The array consists of four such patches arranged in a 2×2 configuration with sequential rotation feeding scheme. Hereby each successive element is rotated 90° in circular manner and the initial signal phases of the elements are also accordingly incremented by 90°. This results in improved axial ratio for the desired polarisation (RHCP).
Simulation setup
A solid angle for determination of PC is defined as shown in Fig. 2 in a polar coordinates representation. For a given direction ![]() blue circular area takes into account all data points of the antenna far-field phase which fall in it. The angular range of the tested area should be large enough to eliminate the noisy effects of the measurement but also sufficiently small for representing the local PCV effects. one must first acquire the phase front data points with as less bias as possible.
blue circular area takes into account all data points of the antenna far-field phase which fall in it. The angular range of the tested area should be large enough to eliminate the noisy effects of the measurement but also sufficiently small for representing the local PCV effects. one must first acquire the phase front data points with as less bias as possible.
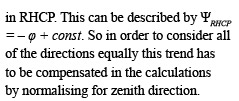
For accurate estimation of the phase centre, one must first acquire the phase front data points with as less bias as possible. A typical bias is azimuthal linear trend of the antenna far-field phase incorporated
Simulation of a single radiator
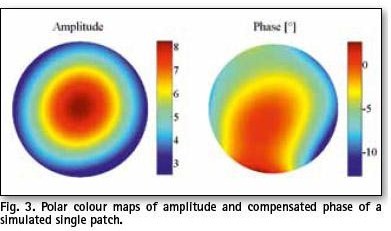
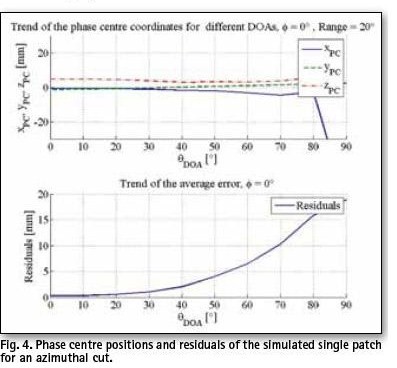
For the following simulations, an arbitrary angular test range of 20° was taken. Due to the feeding method (Fig. 1), simulated phase pattern of the patch antenna is asymmetrical as shown in Fig. 3. A set of directions for PC determination was defined as a single cut by: φ=0° ![]() and Fig. 5. The results show that PC is stable and stays within a 10 mm range for most of the chosen directions accept for the ones close to the horizon (Fig. 4).
and Fig. 5. The results show that PC is stable and stays within a 10 mm range for most of the chosen directions accept for the ones close to the horizon (Fig. 4).
Simulation of the array
Since the structure designed in HFSS™ is rotationally symmetrical, only one of the four radiators was excited in the simulation, thus the pattern of a single radiator together with the mutual coupling effects was obtained. This allows acquiring of the total array pattern and beamforming in software (MATLAB®). The main beam direction was steered to ![]()
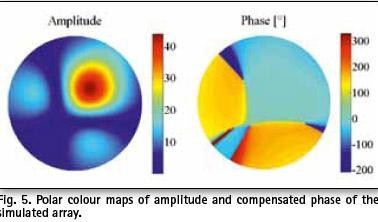
It is evident that the array phase pattern has discontinuities where amplitude pattern has zeros (Fig. 5). These phase shifts are often difficult to filter out performing unwrapping, due to the slow transition of the phase in space.
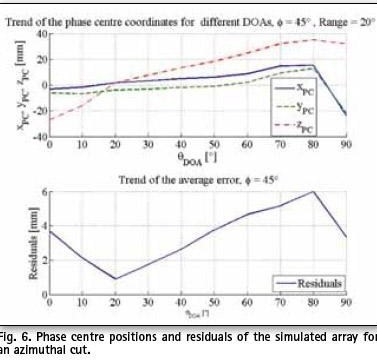
For this study, focus was on the determination of the phase centre in the area where the radiation is significant (main beam). In that area, results show mild PCV within ± 40 mm (Fig. 6).
Measurement setup
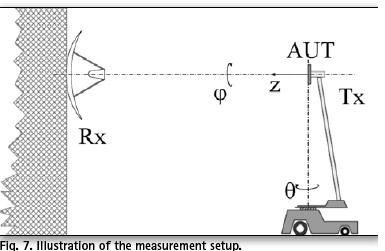
In the measurement, the same geometrical setup has been used as in previous sections. Only the azimuth resolution is somewhat lower (5°) because of the extensive measurement procedure required for recording of the detailed phase front. Although the antennas are intended for GNSS reception, for convenience, they were set in the transmission mode in this investigation, accounting for the reciprocity theorem. Physical setup included mounting of the antenna under test (AUT) on a step motor which is in charge of azimuth. AUT and this motor are situated on a pole (7.5 m high) at the foundation of which is another step motor for scanning of zenith angle (Fig. 7). Also, like in previous sections, azimuthal phase decline of the RHCP was eliminated before the calculations of the PC.
Measurement of a single radiator
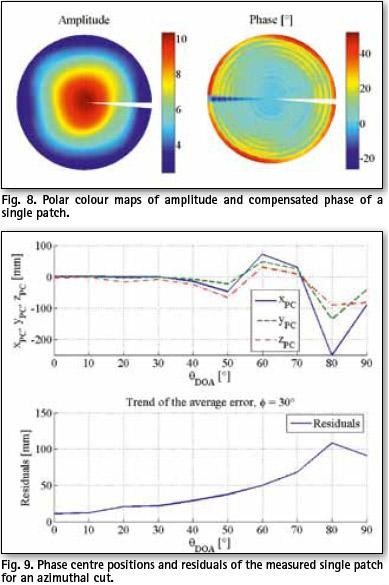
Fig. 8 shows polar diagram of the measured amplitude and phase patterns. Measured data, due to presence of unwanted effects, require more caution than the smooth and robust simulated data even when it comes to a simple radiator. In this case, following the phase characteristic in an arbitrary single φ =30° cut and having the measurement angle resolution in mind, it was decided for a 30° angular range. Estimation of the PC in that cut is shown in Fig. 9.
The recorded phase pattern is rather noisy (Fig. 8). The variations of the PC rise considerably for θ ≥50°, but for the rest of the angular domain the coordinates stay within boundaries of ± 80 mm. It is noticeable that the PCVs as well as the residuals are higher than in the simulation example of the single element antenna.
Measurement of the array
For simplicity, similarly to the simulation case, only pattern of one active element was measured and then imported in MATLAB® for addition and beamforming.
After applying the adequate weighting for maximum radiation in direction , θmax = 45°, φmax = 45°, resulting patterns were obtained (Fig. 10). In this case PC solutions (Fig. 11) are steady for θ < 70°. This can be explained by constructive wave superposition in the angular area of interest (beamforming) where phase undergoes minor variations.
Conclusions
As expected, the phase front curves obtained in the simulations are much less distorted than the measured ones, thus introducing less error in the least square estimation. Therewith calculated PC positions are stable with respect to the zenith angle (Fig. 4). The proposed method allows for estimation of the phase centre variations.
However, in a real-life measurement like one described above, one must account for several unwanted influences, like the impact of the immediate environment, precision of instruments, noise, tolerances, calibration, etc. In the process of antenna fabrication, many unforeseen effects may occur contributing to the deviation of performance of the manufactured models from the initial designs.
Some of these imperfections can be recognised in displayed examples: for instance, in Figs. 8 and 10 phase response shows ripples, especially on the edges of the observed angular domain. This clearly illustrates the problem of the mechanical tolerances of the step-motor, as well as the potential echo contributions due to the environment. This is understandable considering the construction of the positioner, high mounting of the AUT (Fig. 7) and the fact that the measuring system is of the outdoor type.
Antenna array as a multielement radiating structure produces lobes and zeroes in its amplitude radiation pattern and discontinuities in the field phase when going over the spatial zeroes. If concentrating on the angular area of the main lobe, the phase is rather steady and the estimated phase centre locations are consistent between the simulations and measurements.
One general trend can be noticed with both measured and simulated data. The variance of the estimated PC is increased for the directions close to the horizon (θ = 90°). Planar antennas tend to have very low field intensity in that angular area, which leads to higher numerical and measurement noises.
In general, the presented scheme for the phase centre estimation demonstrates very good performance and stability when used with simulated data, but the experiments with the measured data confirm that it is also possible to achieve acceptable precision even with complex antennas like adaptive arrays. Nevertheless, when dealing with far-field data at GHz-frequencies and antennas with non-fixed radiation patterns, a high accuracy positioner and anechoic chamber measurements can be recommended for avoiding considerable mechanical and electrical error effects on the far-field phase.
Acknowledgements
The authors would like to express their gratitude to Wahid Elmarissi for his valuable contributions in preparing and carrying out the antenna phase measurements.
The authors greatly acknowledge the support of this study by German Ministry of Economy and Technology (BMWi) administered by the Agency of Aeronautics of DLR in Bonn in the framework of UniTaS IV project (FKZ 50 NA 0734).
References
Best, Steven R. “Distance-Measurement Error Associated with Antenna Phase-Center Displacement in Time- Reference Radio Positioning Systems”, IEEE Antennas and Propagation Magazine, Vol. 46, No. 2, April 2004.
A. Konovaltsev, L.A. Greda, M.V. T. Heckler and A. Hornbostel, “Phase Center Variations in Adaptive GNSS Antenna Arrays”, 4th ESA Workshop on Satellite Navigation User Equipment Technologies (NAVITEC’2008), 10-12 Dec. 2008, ESTEC-ESA, Noordwijk, The Netherlands.
I.J. Gupta, C. Church, A. O’Brien and C. Slick, “Prediction of Antenna and Antenna Electronics Induced Biases in GNSS Receivers,” Proceedings of the Institute of Navigation’s 2007 National Technical Meeting, San Diego, CA, January 2007.
M. V. T. Heckler, W. Elmarissi, L. A. Greda, M. Cuntz, and A. Dreher, “Narrow-band Microstrip Antenna Array for a Robust Receiver for navigation applications”, European Conference on Antennas and Propagation (EuCAP 2009), Berlin, Germany, Mar. 2009.
 |
|
|||||
 |
|
|||||
 |
|
|||||
My Coordinates |
EDITORIAL |
|
His Coordinates |
John Pottle, V P Agrawal, Shri KR Sridhara Murthi |
|
News |
INDUSTRY | GPS | GALILEO UPDATE | LBS | GIS | REMOTE SENSING |
|
Mark your calendar |
AUGUST 2010 TO NOVEMBER 2011 |




 (4 votes, average: 3.75 out of 5)



Leave your response!