| Applications | |
Geospatial land governance and management
The present research discover the people’s role in land governance and management, and also to see the historical background of land governance in the country, India. We present here the first part of the paper |
 |
|
Geospatial information is forever related to geographic space. It signifies to the immediate geographic world. Geographic space is the space of topography, land use land cover, cadastral, and other landscape features of geographic world. Geographic information systems technology is applied to manipulate objects in geographic space, and to obtain information from spatial facts (Goodchild, 1992). In order to share the geospatial information, the Global Spatial Data Infrastructure (GSDI) facility was setup for international information cooperation which came into existence in July 2003. The fundamental objective of the GSDI organization is to encourage international cooperation and collaboration in support of local, national, and international spatial data infrastructure developments which will allow all the nations to better address their social, economic, and environmental issues at large. So, the geospatial information is a good definition of the space which is measured, described, and represented in its three dimensions and to be made available over and over again (Burrough and McDonnell, 1998).
Earlier, the geoinformation process could be separated into individual disciplines, such as surveying, geodesy, photogrammetry, remote sensing, and cartography during the analogue mapping era. Presently, there are different data acquisition methods such as terrestrial GPS-surveys, aerial photogrammetry, satellite photogrammetry, laser scanning, photo interpretation, digital processing of remotely sensed images which are themselves competing each other in term of the excellence and expenses (Avery, 1992). In this context, these disciplines and technologies application must have been geared corresponding to the global, regional or local levels geospatial information digitalization for land resources mapping and management for solutions to the real world problems as land governance for betterment of humanity on this planet earth.
Land governance and management
Land governance and management are noteworthy matters of concern in the emerging economies and developing countries of the world like India. In agrarian economies, the land is most important assets of the people as ‘to own the land is the highest mark of esteem; to perform manual labour, the lowest’ (Myrdal, 1968). There has been recorded continuous decline in the share of agriculture and allied sectors in its gross domestic product (GDP), from 14.60 per cent in 2009–2010 to 13.90 per cent in 2013–2014, which is an expected outcome for a fast growing and structurally changing economy. So, the falling share of agriculture and allied sectors in GDP is an expected outcome in a fast growing and structurally changing economy. In order to keep up the momentum gained during the 11th Plan and achieve the targeted growth rate of 4.00 per cent during the 12th Five Year Plan have focused approaches and schemes.
There is an ever-changing relationship between land, power and people over the centuries in India. Land provides basic necessities like food, clothing and shelter to man. There have been found conflicts over land and resources which are at present a marked feature of the economic growth and development. The Land Acquisition Rehabilitation and Resettlement Bill 2012’s compensation provisions, at four times the market rate in rural areas and twice in urban areas (Chakraborty, 2013). This will raise land prices exponentially and will fundamentally impede economic growth.
Land Governance in Indo-Aryan era
Ancient records as the RigVeda shows that among the Indo-Aryans, arable land was held in individual ownership or family ownership (Muller, 1849). The Land belonged to the person who cleared the forest and woodland and brought the land under cultivation. So, it appears that the principle of private property and private ownership of land has been recognised from ancient times, in India. Throughout the history, during the ancient period 1200 BC– 200 AD as well as during the recent period 1540 AD–1750 AD, the principal unit of land belong to village settlement, in India (United Nations, 1973). Since land returns was the main source of state revenue, the village became the agency for collection and unit of revenue assessment.
Land Governance in British India
The Britisher’s governed over land for long time, which is known as the colonial era, for over the centuries 1750 AD–1947 AD over the country, India. The Permanent Settlement Regulation (PSR) in 1793 was introduced to record all rights in respect of land and to maintain an up-to-date record of land rights, which was completely failed to implement in the country. At the time of independence, in the country, India, the land tenure systems preserved in three main categories, namely, the Zamindari, the Ryotwari, and the Mahalwari tenures (Mukherjee and Frykenberg, 1979). Each one of these were accounting for about 57.03 per cent, 38.14 per cent and 5.02 per cent of the total privately owned agricultural land.
![]()
Land Governance in Independent India
The India became independent country on the 15th August 1947 of the world and adopted their own constitution which came into effect on 26th January 1950 (GoI, 2007). For all round development of the country, the Planning Commission was set up by a resolution of the Government of India in March 1950. The First Five Year Plan was designed and launched for 1951–56 and thereafter the two subsequent five-year plans were formulated till to present, the Twelfth Five Year Plan, 2012–2017. While keeping this in view, it was assumed that the planning in the country, in general, is that it should increasingly be of an indicative nature. So, since the independence the main emphasis has been on industrialisation of the country, India. Because the agriculture has been treated as a symbol of economic backwardness. Along with the independence, however, the land reforms and agriculture development were paid more attention though the main focus during the plans was on the industrial sector development.
Objectives of the study
The Geospatial land governance and management is a complex matter of discussion and it has been paid a lots of attention since long world widely for the betterment of society. The present research discover the people’s role in land governance and management, and also to see the historical background of land governance in the country, India. In view of this, the main objectives of the present study are mentioned as follows:
i. to perceive historical background of land governance, management and digitalisation;
ii. to evaluate geospatial trends of natural resources utilization as land use land cover;
iii. to explore geospatial trends and patterns of agricultural land development;
iv. to examine geospatial trends and patterns of land governance by digitalisation;
v. to suggest suitable lessons learned from land governance and its management.
So, the present research take into account the details of the issues and features of the land governance and management practiced over the periods since the beginning of the ancient time to the present in context to the national land development strategies while dealing with the latest plans and policies of the country, India.
Database of the study
The present study is based on the secondary data available from the different sources as the Agricultural Census, Agricultural Statistics, and Annual Reports etc. which are annually published by the Department of Agricultural and Cooperation, Ministry of agriculture, Government of India, Krishi Bhavan, New Delhi. In addition to this, the present study is also supported by ancillary data available from the Annual Reports published by the Ministry of Rural Development, Government of India, New Delhi. And, the number of volumes have also been taken into consideration of the Five Year Plans published by the Planning Commission, Government of India, Yojana Bhavan, New Delhi. However, the big data have been used in digitalization for real world problems solutions for land governance and its management for the country, India.
Besides this, the National-level Land Use and Land Cover (LULC) mapping at 1: 2,50,000 scale using multi-temporal Resourcesat-1 AWiFS data have also been taken up and analysed using hierarchical decision tree and maximum likelihood algorithm, and interactive classification techniques. Additionally, surface water bodies and snow and glaciers layers for entire country have also been generated for LULC classification and mapping (NRSC, 2006b). While keeping in view for the wider applicability of remote sensing for the land use land cover, a classification scheme has been devised using of 1: 50,000 scale map which consists of Level-I: 9 classes, Level- II: 29 classes and Level-III: 79 classes (NRSC, 2006c and NRSC, 2007). Likewise, the LULC Atlas for India was prepared and released for the use of various departments, central, state and others organisations (NRSC, 2011). Land Cover is defined as observed physical features on the Earth’s Surface as forest cover, water body and so on. As soon as an economic function is added into this, it becomes Land Use. The multitemporal Resourcesat-1, LISS III data for the period of 2005-06 acquired to derive information on the spatial and temporal variability of different land use land cover categories. Such kinds of the multi-temporal datasets were georeferenced with Land Cover Classification (LCC) using the Traverse Mercator (TM) Projection and WGS 84 datum (NRSC, 2007). Besides, the ancillary data consisted of base details namely: the administrative boundaries as international, state, district, tehsil, village and forest boundary, as well as the major roads, railway, drainage, settlements, etc. were taken from available sources. Correspondingly, available ancillary information on wastelands and forests generated was also quantified during digitalisation of land use land cover mapping for the country, India as a whole.
Research methodology
Geospatial technologies are playing an important role in natural resources mapping, land governance and its management through big data digitalisation for sustainable development, at large. With the advancement of Indian Remote Sensing (IRS) satellite programs over the periods, a variety of remote sensing-based solutions have been provided for all round development of the country as well as to the world. In other words, due to recent remote sensing technological development as the Earth Observation (EO) from space platforms have been largely used in geospatial information digitalisation at spatio-temporal levels. The EO Satellites play an essential role in generation and dissemination of digital information on land use land cover patterns in a timely and dependable manner providing vital inputs required for optimum land use and planning for sustainable development. The Digital Image Processing (DIP) methodology adopted consists of satellite data preparation, onscreen visual interpretation, ground truth data collection, map finalization, quality checking of final maps and databases organization based on recommended standards (NNRMS, 2009).
The Big Data computation requires statistical tools and techniques for summarization in form of final results. The empirical studies shows that there are statistical techniques used for land governance as Gini’s Coefficient (GC) is used to measure the extent of concentration. This method measure of inequalities which is commonly used to gain an over-all view of the prevailing geospatial inequalities. In spite of the limitations of this measuring method, it has been used in the number of studies to compute the geospatial concentration of inequalities of various variables (Dorfman, Robert, 1979; Gastwirth, Joseph L., 1972; and John, Weymark, 2003). So, in the present study, in order to eliminate the bias arises due to the changes in the number of each states, the Gini’s Coefficient for the different periods have been computed. The statistical presentation of the equation used for calculation of the Gini’s Coefficient is described as follows:
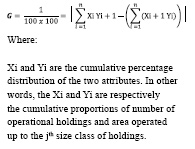
So, the concentration of land holdings in terms of Gini’s coefficient among different states have been worked out for the periods 1960-61, 1970-71, 1980- 81, 1990-91, 2000-01, and 2010-11 for the country, India as a whole.
Study area
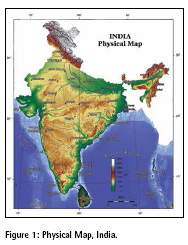
India is situated to the north of equator, between the geographical extent of 08° 04’ and 37° 06’ north latitudes and 68° 07’ and 97° 25’ east longitudes. Physiographical features reveals that the lofty Himalayans covered with snow and glaciers are lying in the north. The Great Indo-Gangetic Planes with fertile land drained by navigable perennial rivers are lying below the Himalayas. The Peninsular India is geologically oldest stable landmass rich in mineral resources surrounded by seas as Arabian Sea, Bay of Bengal and Indian Ocean lying in the south as is evidenced by the Figure 1.
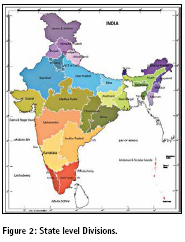
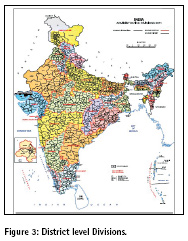
Besides this, the States level as well as the districts level latest available administrative divisions at the states level and districts level based on the Census of India, 2011 are also presented in the Figure 2 and Figure 3, respectively. However, the Land information in terms of administrative divisions’ statistics showed that there were 28 States which contains about 640 districts in 2011. Likewise, there were around 5,924 sub– districts which comprised by tehsils, talukas and blocks. In addition to this, there was a large number of villages which accounted for about 6,40,930 villages in the country, India during 2011.
Results and discussions
Geospatial trends of land utilisation
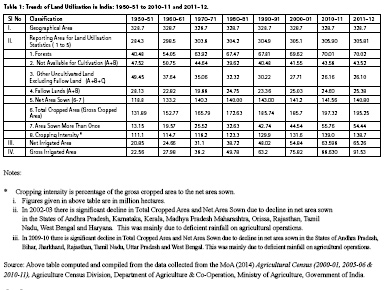
The Natural resources in terms of the land use and land cover statistics for the periods beginning from 1950-51 to 2010- 11 and 2011-12 is presented in the Table 1. It is evident that there is about 328.7 million hectares of geographical area or the land cover found exist since 1950- 51 till to 2010-11, in the country, India. The net sown area is accounted for about 46.00 per cent of the total reporting area of the country in the year 2010-11 which has increased from 41.80 per cent in 1950- 51. Whereas, the world average is about 32.00 per cent in the same period of 2010- 11. The forest cover was increased from 14.20 per cent in 1950-51 to about 22.90 per cent in 2010-11. On the other hand, the barren and unculturalable land was decreased from 13.40 to 5.60 per cent during 1950-51 to 2010-11, respectively.
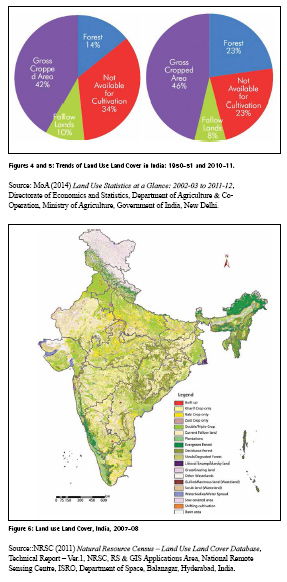
It is also evidenced from the Table 1 that during 1950-51, the gross cropped area was about 131.89 million hectares, out of which 13.15 million hectares or 9.97 per cent, was as sown more than once and the cropping intensity was 111.10. Thereafter, over the period of about 30 years, in 1970-71 period the gross cropped area was increased to about 165.79 million hectares out of which 25.52 million hectares or 15.39 per cent was sown more than once and the cropping intensity value recorded of 118.2. Furthermore, over another 30 years period, during 2010-11 the gross cropped area was increased to about 197.32 million hectares, out of which 55.76 million hectares or 28.26 per cent was as sown more than once and the cropping intensity further increased to about 139.0 as is evidenced by the Table 1. Besides this, it is inferred from the results presented in the Table 1, that there is found changing patterns of land use land cover over the periods beginning from 1950-51 till to 2010-11 in the country, as a whole which is also graphically evidenced by the Figures 4 and 5.
Geospatial patterns of natural resources and management
Land Use and Land Cover
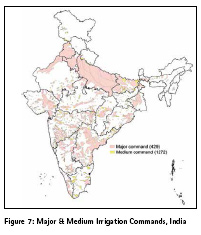
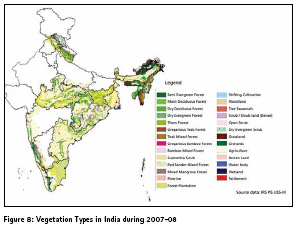
National–level Land Use and Land Cover (LULC) map at 1: 2,50,000 scale using multi-temporal Resourcesat–1 Multitemporal AWiFS data have been processed and analysed using hierarchical decision tree and maximum likelihood algorithm, and interactive classification techniques. In addition to this, the surface water bodies and snow cover, glaciers digital layers for entire country, India have also been generated using the satellite imagery. So, the different layers have been merged together and then integrated LULC map produced for the period of 2007-08 which is presented in the Figure 6. Whereas, the Major and medium irrigation command boundary maps were obtained from concerned departments of different states. There are 1,701 major and medium irrigation commands covering 88,896 thousand hectares, which is 27.04 per cent of the geographical area of the country. Number of major and medium irrigation commands are 429 and 1,272, respectively as is evidenced by the Figure 7. The Vegetation Types in India has been classified based on the IRS–6 satellite imagery for the period 2007–08 which is presented below in Figure 8. The Vegetation type map provides information on spatial extent and distribution of single species dominated vegetation formations, ecologically unique formations, mixed species formations and degraded formations. The spatial delineation of these habitats overlaid with 12,000 field species data in digital domain helps evaluating the regions of bio-prospecting value.
So, the vegetation type map, the first of its kind of systematically organized databases has been developed for India, will serve as a primary database for all types of ecological studies and would serve as benchmark for further environment related studies. The vegetation type maps also provide basic inputs for identification of species habitats.
![]()
Land degradation and management
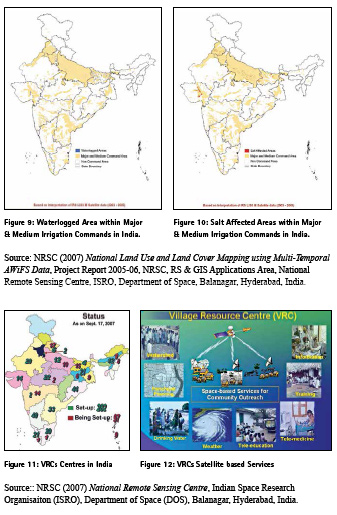
The Figure 9 and 10 shows the waterlogged area within major and medium irrigation commands in different states of the country, India. The perennial and seasonal waterlogged areas have been mapped using the satellite imagery. So, the total waterlogged areas or in other words, the land not available for cultivation due to waterlogging within major and medium irrigation commands in the country is accounted for about 1,719 thousand hectares which is about 1.93 per cent of the command area. Furthermore, the perennial waterlogging covers an area of about 173 thousand hectares, on the one hand. The seasonal waterlogging covers an area of about 1546 thousand hectares, on the other hand. However, the total waterlogged area within major and medium irrigation commands is accounted for about 0.52 per cent of the geographical area of the country, India. There is an urgent need for proper management of waterlogging problems in order to protect thousands of hectares of arable land which is normally caused by the perennial and seasonal running and stored water resources in the country, India as a whole.
The salted affected areas with major and medium irrigation commands for India have been generated using IRS P–6, LISS–III sensor of the satellite imagery for the country, India for the period 2003–05 which is presented in the Figure 10. So, in order to assess the salted affected areas caused by irrigation in the arable lands, the soil testing have been carried out for the country, India.
The Soil samples were collected from major and medium irrigation commands of each state. The soil samples were tested for EC, pH and ESP. The salt affected areas are lying in different states in the country within major and medium irrigation commands. The Total salt affected area in the country as per the analysis is accounted for about 1,035 thousand hectares which is around 1.16 per cent of the command area. It covers a marginal land proportion of about 0.31 per cent of the geographical area of the country which is presented in the Figure 10. So, there is an urgent need to reclaim and rejuvenate the degraded land through application of geospatial tools and technologies for land management and sustainability of land resources in the different parts of the country, India.
Village Resource Centres – Cadastral Management
The Village Resource Centres (VRCs) is the unique initiatives that uses Satellite Communication (SATCOM) network and Earth Observation (EO) satellite data in a judicious combination to address the needs of the local people in villages of the country, India. The VRCs use a combination of SATCOM and EO to reach out to the villages and provides wide varieties of services, as agricultural advisories, non-formal education, computer education, skill development and so on. Among the services, the cadastral mapping at the household’s level of the villages is one of the important land resource mapping service performed at the VRCs for land governance in the country, India.
At present, there are about 461 village resource centres (VRCs) established in 22 states and union territories which are as Andhra Pradesh (17); Assam (13); Bihar (19); Delhi (2); Gujarat (10); Jharkhand (26); Himachal Pradesh (30); Karnataka (58); Kerala (21); Madhya Pradesh (24); Maharashtra (18); Meghalaya (1); Nagaland (8); Orissa (44); Puducherry (9); Rajasthan (21); Sikkim (19); Tamil Nadu (54); Uttarakhand (18); Uttar Pradesh (30); West Bengal (10) and Andaman & Nicobar Islands (4) as is evidenced by the Figure 11. The VRCs node also included about 81 Expert Centres set–up in the country, India. The major benefits of VRCs are as the rural empowerment, smart governance, computerised gram panchayats, distance education, remote health care services, employment opportunities, access to products and services available to city dwellers is schematically presented in the Figure 12.
There are more than 6,500 programmes which have been conducted by the VRCs in order to cater the needs of people in the areas like, agriculture and horticulture development; fisheries development; livestock development; water resources; tele health care; awareness programmes; woman’s empowerment; supplementary education; computer literacy; micro credit; micro finance; skill development and vocational training for livelihood support etc. So far, more than five Lakh people each year have been benefitted by the VRC services in different parts of the country, India. Now, with the advancement in satellite communication technology, the VRCs are playing an important role in overall development of the country, India. However, the Village Resource Centres (VRCs) programme launched by the Indian Space Research Organisation (ISRO) of the Department of Space (DOS), Govt. of India which disseminates a portfolio of services emanating from space systems directly to the rural communities of the country, India. The programme is executed in association with NGOs and Trusts and the State and Central govt. agencies.
References
Avery, T. E. and G. L. Berlin (1992) Fundamentals of Remote Sensing and Air Photo Interpretation, New York, Macmillan Publishing Company. Burrough, P. A. and R. A. McDonnell (1998) Principles of Geographical Information Systems, Oxford, Oxford University Press.
Chakravorty, Sanjoy (2013) The Price of Land: Acquisition, Conflict, Consequence, New Delhi, Oxford University Press, India.
CoI (2011) Census of India 2011, Administrative Atlas of India, New Delhi, Census of India, Office of the Registrar General & Census Commissioner, India Ministry of Home Affairs, Government of India.
Dorfman, Robert (1979) “A Formula for the Gini Coefficient”, The Review of Economics and Statistics, Vol. 61, No. 1, pp. 146–149.
Gastwirth, Joseph L. (1972) “The Estimation of the Lorenz Curve and Gini Index”, The Review of Economics and Statistics, Vol. 54, No. 3, pp. 306–316.
GoI (2007) Report of the Working Group on Natural Resources Management, Eleventh Five Year Plan (2007- 2012), Volume I: Synthesis, Planning Commission, Government of India.
Goodchild, M. F. (1992) “Geographical Information Science”, International Journal of Geographical Information Systems, Vol. 6, No. 1, pp. 31-45.
John, Weymark (2003) “Generalized Gini Indices of Equality of Opportunity”, Journal of Economic Inequality Vol. 1, No. 1, pp. 5–24.
MoA (2014) Agricultural Census 2010-11: All India Report on Number and Area of Operational Holdings, New Delhi, Agriculture Census Division, Department of Agriculture & Co-Operation, Ministry of Agriculture, Government of India.
MoA (2014) Land Use Statistics at a Glance: 2002-03 to 2011-12, Directorate of Economics and Statistics, Department of Agriculture & Co- Operation, Ministry of Agriculture, Government of India, New Delhi.
Mukherjee, N. and R. E. Frykenberg (1979) “Ryotwari System and Social Organisation in the Madras Presidency”, in R. E. Frykenberg (eds.) Land Control and Social Structure in Indian History, Delhi, Manohar Publications.
Muller, Friedrich Max (1849-75) The Hymns of the Rigveda, London, 6 Volumes, 2nd edition, Oxford.
Myrdal, Gunnar (1968) Asian Drama, Vol. II, New York.
NNRMS (2009) Satellite Remote Sensing Applications, National Natural Resources Management System, Department of Space, Bangalore, India.
NRSC (2006b) Land Use Land Cover Atlas of India (Based on Multitemporal Satellite Data of 2005- 2006), Department of Space, ISRO, GOI, Hyderabad, India.
NRSC (2006c) Manual of National Land Use Land Cover Mapping Using Multi- Temporal Satellite Data, Department of Space, Hyderabad, India.
NRSC (2007) National Land Use and Land Cover Mapping using Multi-Temporal AWiFS Data, Project Report 2005- 06, NRSC, RS & GIS Applications Area, National Remote Sensing Centre, ISRO, Department of Space, Balanagar, Hyderabad – 500 625, India.
NRSC (2011) Natural Resource Census – Land Use Land Cover Database, Technical Report – Ver.1, NRSC, RS & GIS Applications Area, National Remote Sensing Centre, ISRO, Department of Space, Balanagar, Hyderabad – 500 625, India.
U. N. (1973) The Agrarian System in Ancient India, Calcutta, Non-fiction Publisher.
United Nations (2014) Millennium Development Goals Report 2014, New York, United Nations.
To be continued in the next issue.


 (No Ratings Yet)


Leave your response!